Error Tracking & Application Performance Monitoring

Move fast and fix things

Intelligent logging, error tracking, and Just Enough APM™ in one dev-friendly platform. Find and fix problems before users notice.
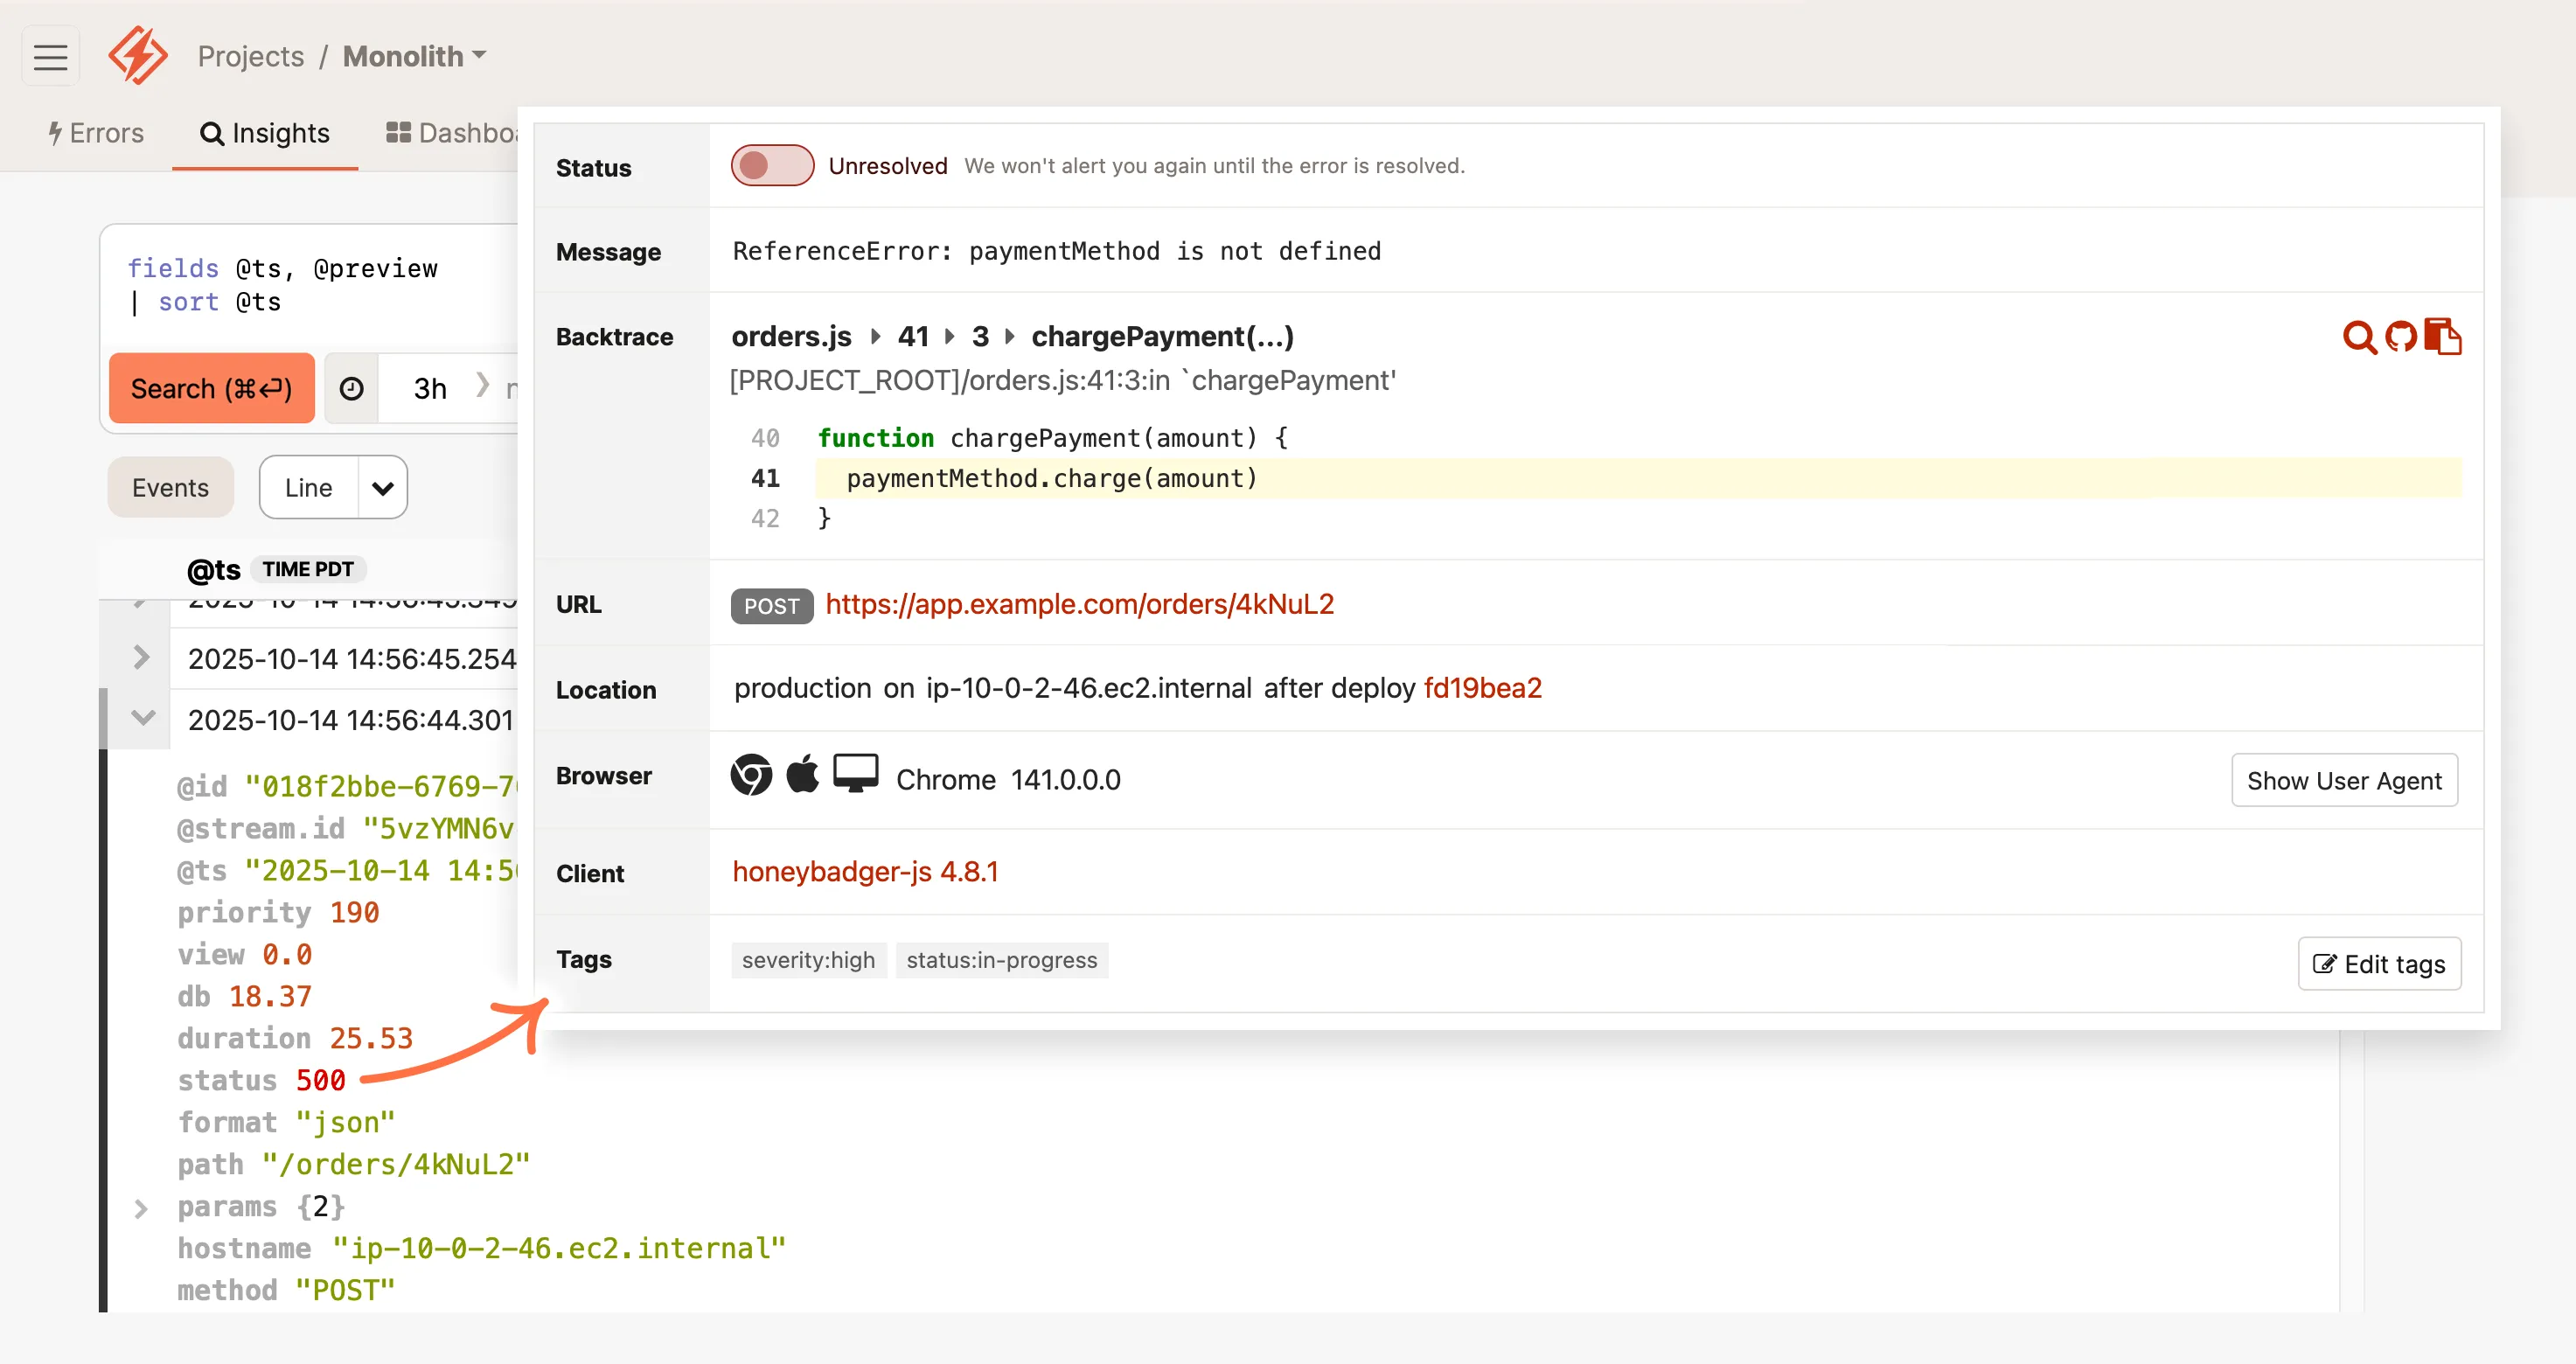
Screenshot of an error monitoring dashboard with an unresolved NoMethodError in 'charge_payment' method from a Ruby on Rails application, showing a code snippet, error details, and metadata like URL and browser version. An arrow points from structured application logs to the error details in Honeybadger. Speech bubble that reads 'Devs love our automatic error reports'
Company logos: Digital Ocean, Thoughtbot, Workable, Wistia, Zappos

All-in-one monitoring for web apps in production

Honeybadger combines the best of error tracking and application monitoring in one simple interface, helping you respond quickly and fix issues in record time.

Intelligent Logging & Error Tracking

Find and fix issues quickly
Fix errors faster with real-time alerts, smart de-duping, and context-rich events from your logs.

Application Observability

Log everything, ask anything
Log. Query. Dominate. Key info about errors, user activity, app performance, and more are just a click away.

APM Lite

Easy dev-friendly dashboards
All the metrics you need. None of the complexity that you don't. Plays well with New Relic and Datadog.

Honeybadgers: Small, fierce, and focused

Since 2012, our small bootstrapped team has prioritized the needs of our fellow developers. We don't stuff our products with irrelevant features or chase VC growth targets with aggressive sales tactics.

We build products for devs who build and support great web apps in production – just like us.

Joshua Wood & Benjamin Curtis
Honeybadger.io Co-founders

All the power, none of the complexity

Error Tracking

Fix errors before customers complain

  • Instant alerts with rich error context
  • Smart grouping reduces noise
  • Advanced search and query tools
Learn more about Error Tracking
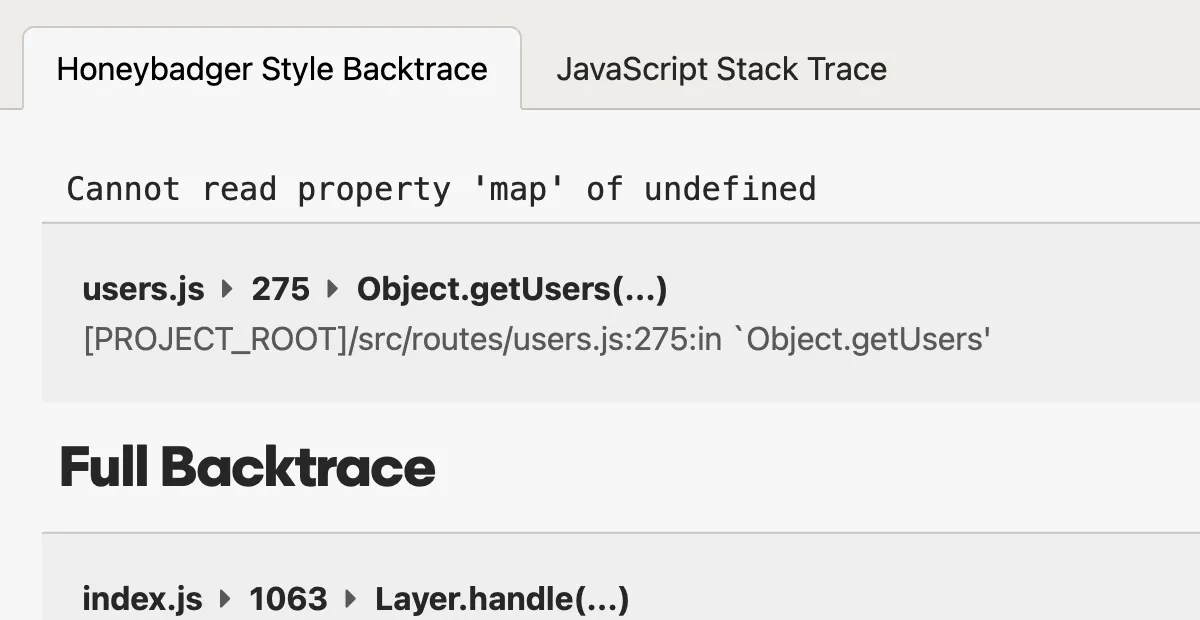
A screenshot of a error tracking stack trace in Honeybadger's error tracking interface.
Honeybadger filters out framework noise to show exactly where your code broke.

Logging & Observability

Debug production issues in minutes, not hours

  • Structured logs that you can query and analyze
  • Trace events across requests, jobs, and services
  • Instant alerts from any pattern or event
Learn more about Logging & Observability
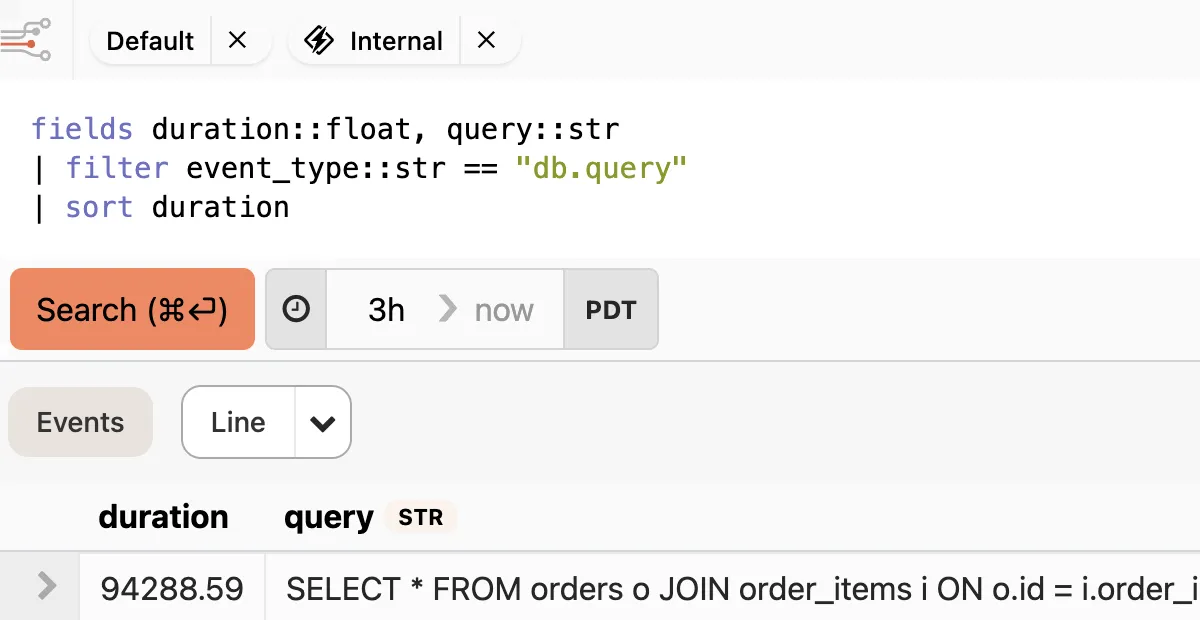
A logging query interface from an application monitoring tool showing filtered results for "db.query" events sorted by duration, with a 3-hour time range and a table displaying query execution times and SQL statements.
Every event in Honeybadger can be queried, analyzed, and even turned into metrics.

Application Performance Monitoring

Keep tabs on your apps and infrastructure

  • Automatic dashboards for your stack
  • Monitor web, worker, and query performance
  • Create custom metrics without writing code
Learn more about Dashboards & APM
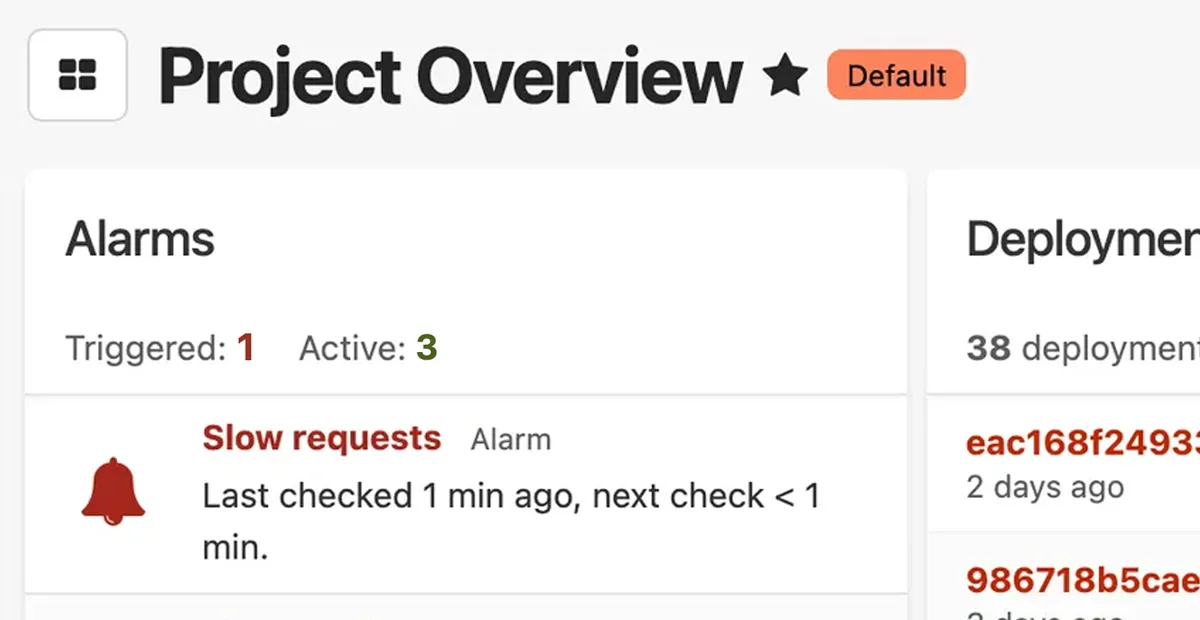
A application performance monitoring dashboard for a web application labeled "Project Overview". The monitoring dashboard shows a "Slow requests" alarm checked 1 minute ago, and a deployments section with 38 deployments listed.
See everything that matters in one place so you can spot trends and fix issues faster.

Uptime Monitoring

Know when your app is down before your customers do

  • Instant alerts when your site goes down
  • Know exactly what's broken—not just that it's down
  • Wake the right person with smart escalation rules
Learn more about Uptime Monitoring
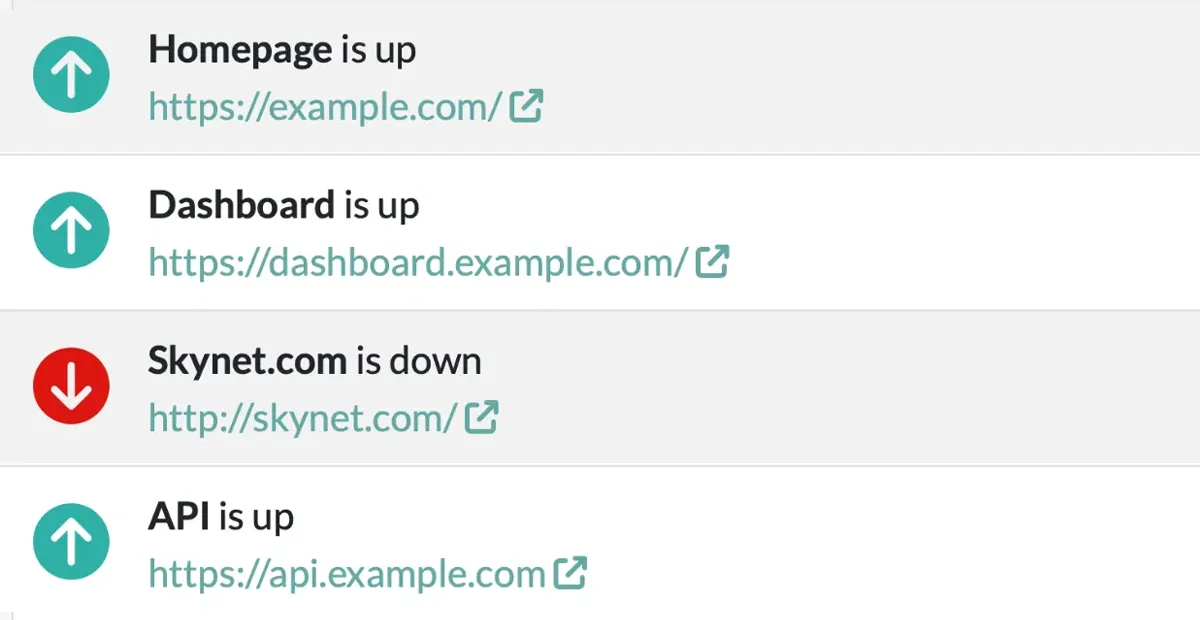
A screenshot of a list of uptime checks in Honeybadger's uptime monitoring interface.
Real-time monitoring from multiple locations ensures you know about outages first.

Cron Monitoring & Heartbeats (Check-ins)

Make sure your background jobs and tasks run on time

  • Alerts you when jobs fail or don't run at all
  • Tracks success rates and execution over time
  • Simple heartbeat API works with any stack
Learn more about Cron & Heartbeat Monitoring
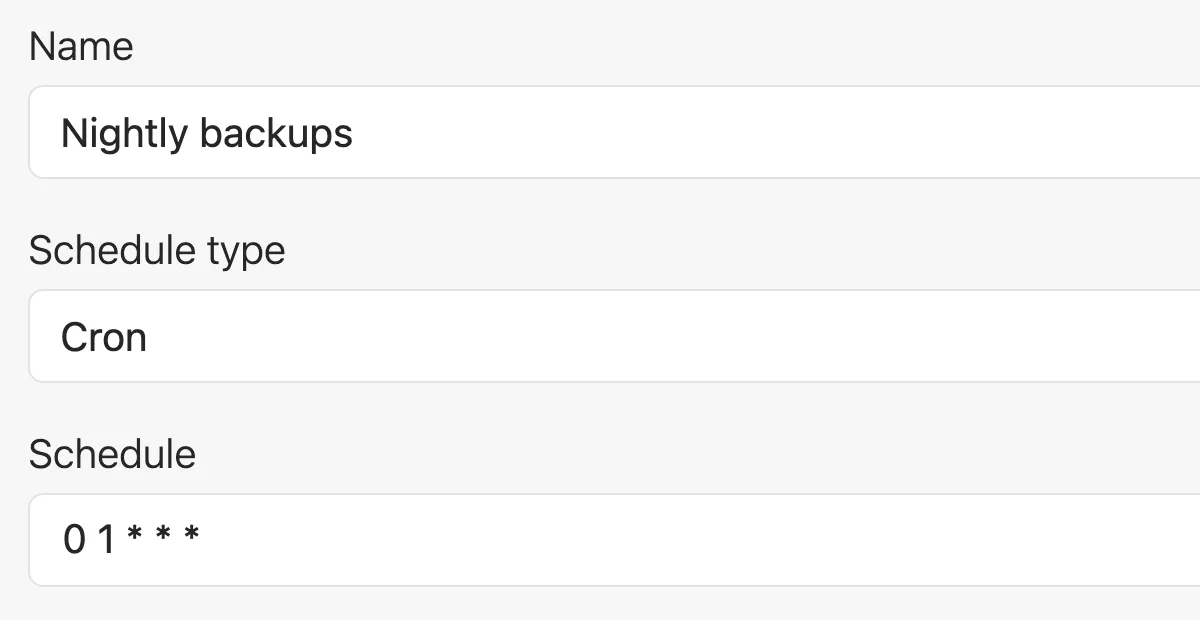
A screenshot of a form that lets you create a check-in in Honeybadger's cron monitoring UI. Three fields are visible: Name (Nightly backups), Schedule type (Cron), and Schedule (a daily cron schedule).
Set it and forget it—Honeybadger watches your scheduled tasks so you don't have to.

Status Pages

Keep your customers informed during an outage

  • Automatically updates when issues are detected
  • Reduces support tickets during incidents
  • Professional status page with your domain and branding
Learn more about Status Pages
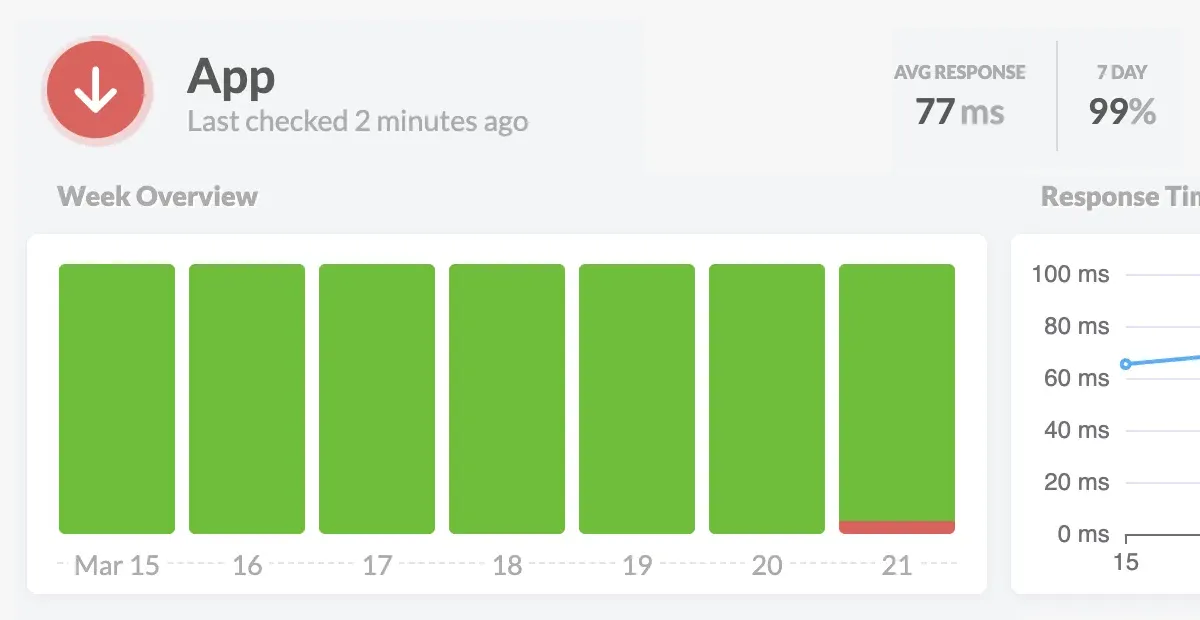
An uptime monitoring status page for a application showing current performance metrics and recent availability history. The status page interface displays "App" with "Last checked 2 minutes ago" alongside key performance indicators: 77ms average response time and 99% uptime over the past 7 days. The 24-hour timeline for the last day in the chart is predominantly green (indicating normal operation) with a small red segment near the end signaling a recent outage.
When an uptime check fails, we alert you and update your status page automatically.

Getting started is easy

Setup takes just a few minutes and comes with great defaults.

Installing Honeybadger in a Rails app is just a few terminal commands:

$ bundle add honeybadger
$ bundle exec honeybadger install [API KEY]

That’s it. See the developer docs for the latest instructions.

Honeybadger works where you do

If you use it, Honeybadger probably supports it. If we don't, let us know—we respond to feature requests!

Industry-leading support

Any Honeybadger customer will tell you that we have the best developer-led support in the industry. Go ahead and email us right now—you'll get a fast reply from our dev team, and we'll go above and beyond to answer your questions.
Ben Curtis

Ben Curtis

To: Jason Charnes

Subject: Re: Uploading logs

Happy to help! And thanks for letting me know it (mostly) worked. I guess I have some debugging to do on that environment variable. :)

One last thing... make sure you run this to get Vector to start after a reboot:

sudo systemctl enable vector.service

I put that in the gist after I sent the last email to you, so you may have done that already, but you may not have, and it doesn't hurt to do it twice. :)

Oh, and about the log prefix you mentioned... look in config/environments/production.rb for config.log_tags and comment that out. That's probably what's adding that stuff to your logs.

Jason Charnes

Jason Charnes

To: Honeybadger Support

Subject: Re: Uploading logs

That did the trick!!

This is so awesome. Again, thank you!

Used by tens of thousands of developers to ship faster

Honeybadger is used by companies of all sizes who want to focus on shipping great, error-free products instead of wasting time building and maintaining a bespoke monitoring stack.

Here's what a few of our customers have to say

"Wow — Customers are blown away that I email them so quickly after an error."
Chris Patton
Chris Patton
Founder of Punchpass.com
"The whole setup took about 10 minutes - that's with me moving really slowly. Nicely done!"
Felix Livni
Felix Livni
Co-founder of Schedulista.com
"We've looked at a lot of error management systems. Honeybadger is head and shoulders above the rest and somehow gets better with every new release."
Michael Smith
Michael Smith
Co-Founder & CTO of YvesBlue

Monthly updates from the HB team

Stay in the loop with new features, monitoring tips, and behind-the-scenes stories from our dev team.

We'll never spam you; we will send you cool emails you won't want to miss.

Simplify your life with Honeybadger

Get monitoring done.

Get real-time alerts when code breaks, monitor performance, and fix errors in record time.