Phoenix Monitoring for Elixir
Full-stack application monitoring for Phoenix
Ship better software, faster. Everything you need to fix Phoenix errors and performance issues in one powerful platform that fits your workflow.


Phoenix monitoring doesn't need to be so frustrating
That's why we built Honeybadger. Honeybadger simplifies your stack by combining all your essential application monitoring tools in one powerfully simple Phoenix monitoring platform—helping you respond quickly and fix issues in record time.
Intelligent Logging & Error Tracking
Application Observability
Just Enough APM™
Honeybadgers: Small, fierce, and focused
Since 2012, our small bootstrapped team has prioritized the needs of our fellow developers. We don't stuff our products with irrelevant features or chase VC growth targets with aggressive sales tactics.
We build products for devs who build and support great web apps in production – just like us.


Joshua Wood & Benjamin Curtis
Honeybadger.io Co-founders
Getting started is easy
Setup takes less than 5 minutes and comes with great Phoenix defaults.
Installing Honeybadger in a Phoenix app is just a few lines of code:
# mix.exs
defp deps do
  [{:honeybadger, "~> 0.24"}]
end

# config/config.exs
config :honeybadger,
  api_key: "Honeybadger API key",
  environment_name: config_env(),
  insights_enabled: true # Enable logging and performance insights

# lib/myapp_web/router.ex
defmodule MyappWeb.Router do
  use MyappWeb, :router
  use Honeybadger.Plug

  pipeline :browser do
    [...]
  end
end
Then run:
$ mix do deps.get, deps.compileOnce installed, Honeybadger automatically reports errors in controllers and background jobs and collects application logs and performance metrics. Phoenix application monitoring has never been easier.
Six dazzling features for Phoenix developers
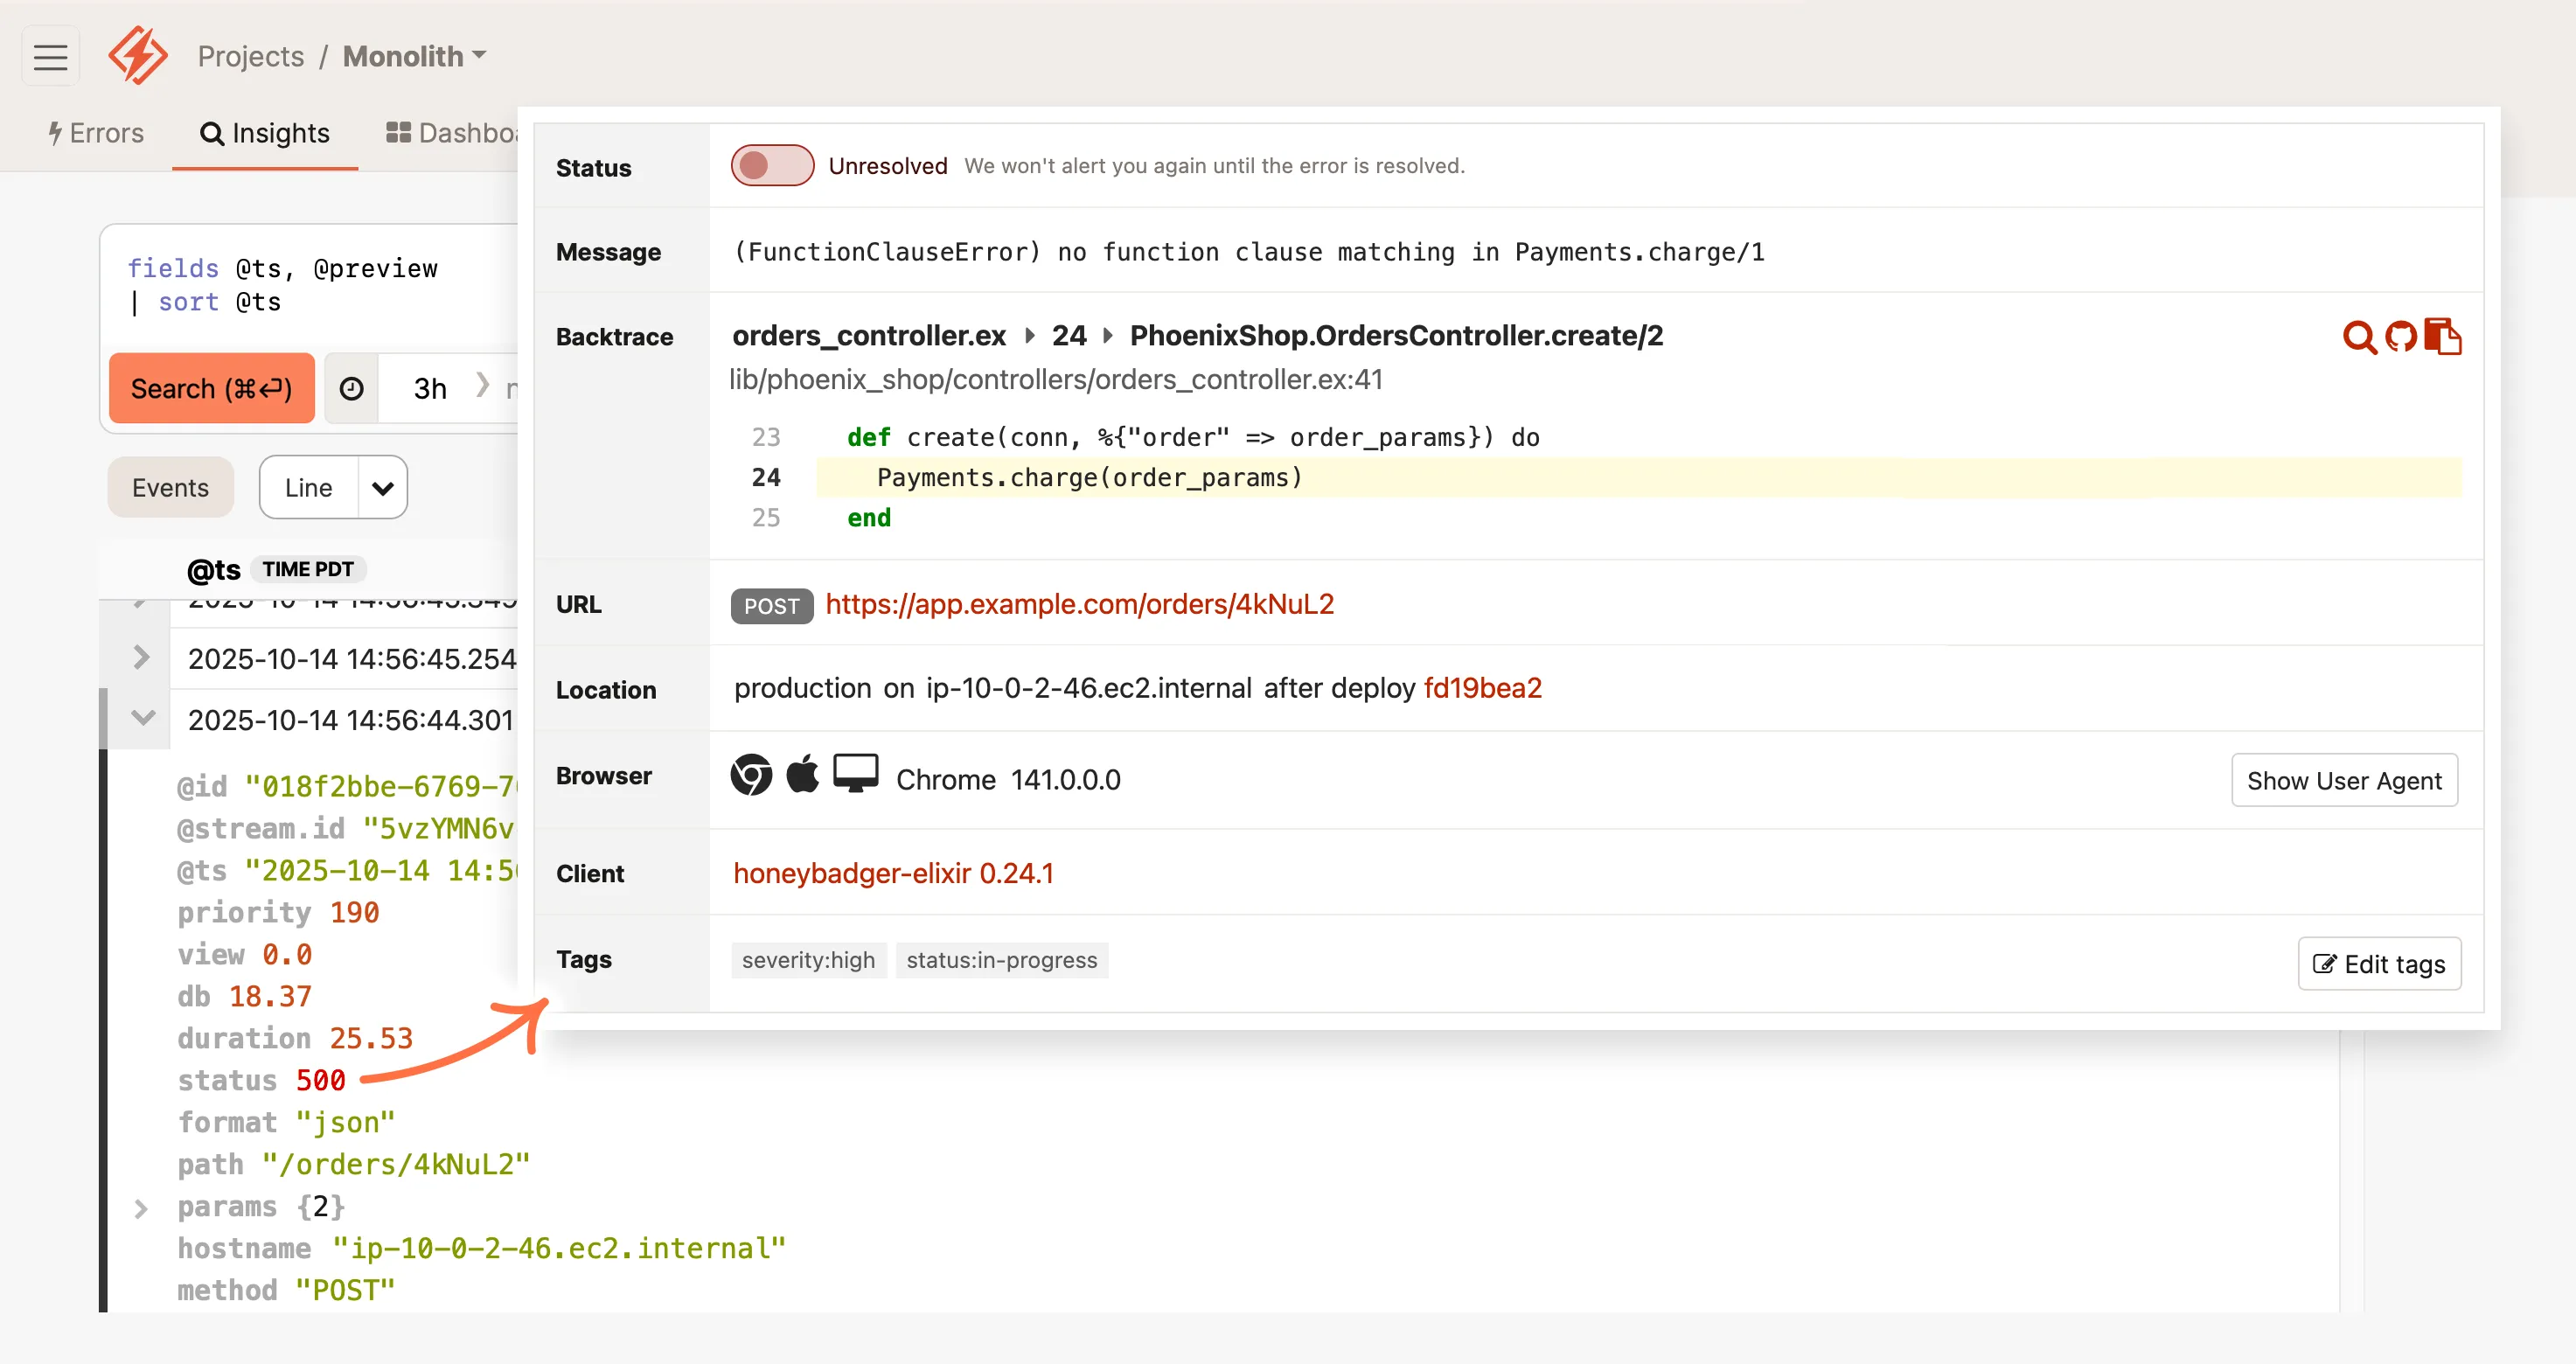
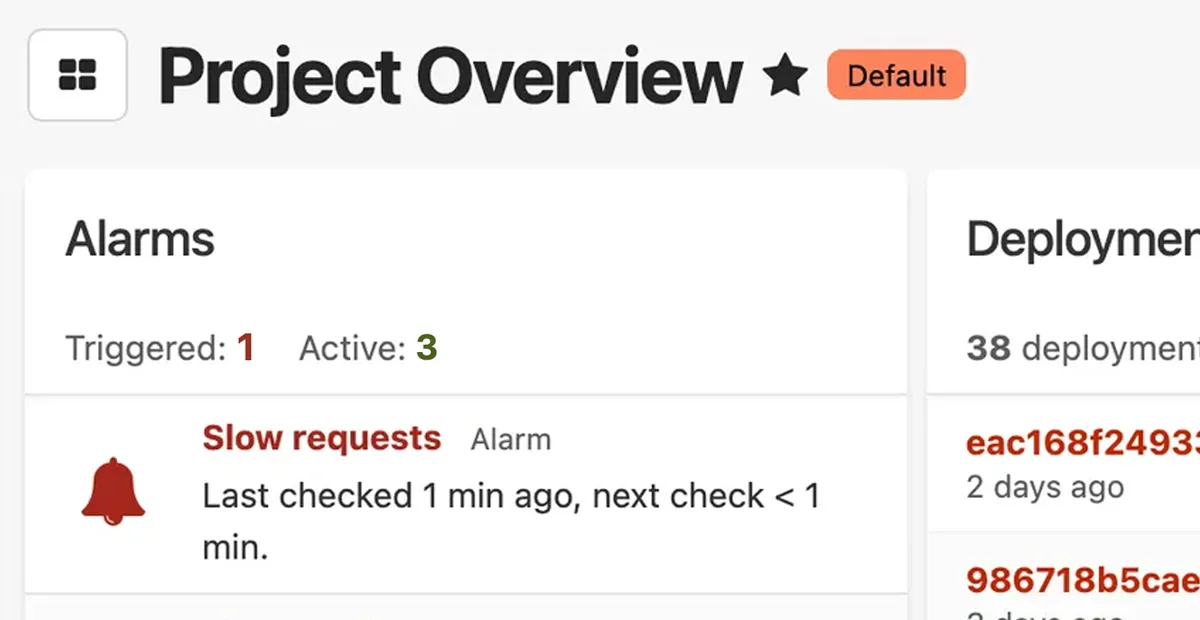
Phoenix Error Tracking
Fix Elixir errors before customers complain
- Instant alerts with rich error context
- Smart grouping reduces noise
- Advanced search and query tools
Phoenix Logging & Observability
Debug production issues in minutes, not hours
- Structured Phoenix logs that you can query and analyze
- Trace events across requests, jobs, and services
- Instant alerts from any pattern or event
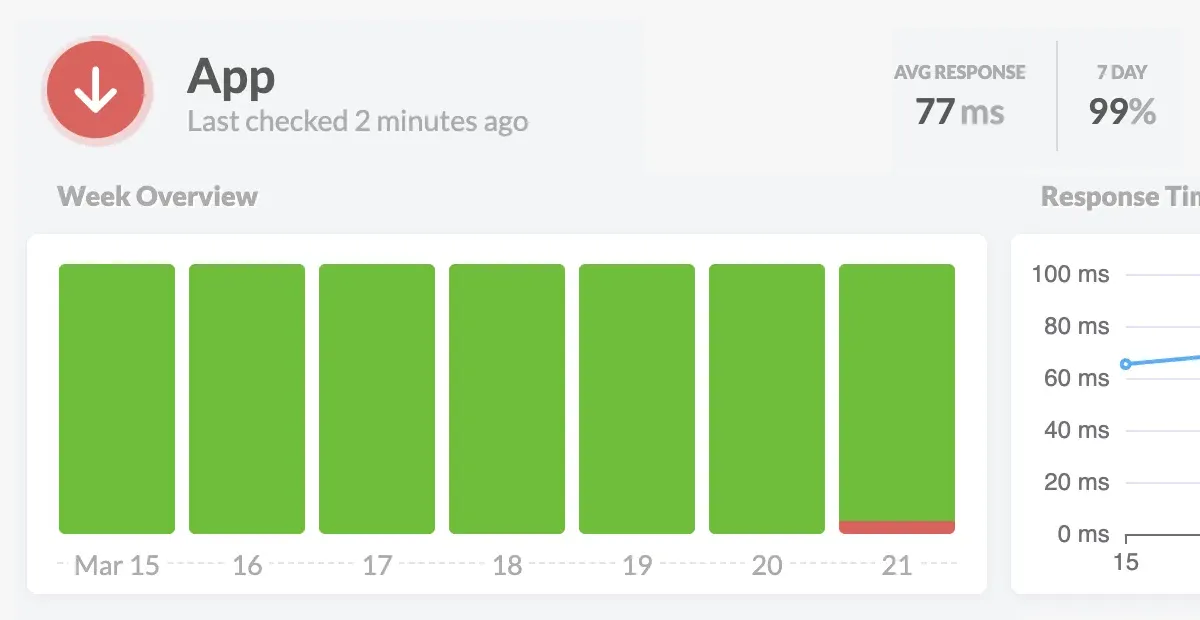
Phoenix Performance Monitoring
Keep tabs on your apps and infrastructure
- Automatic dashboards for your stack
- Monitor web, worker, and query performance
- Create custom metrics without writing code
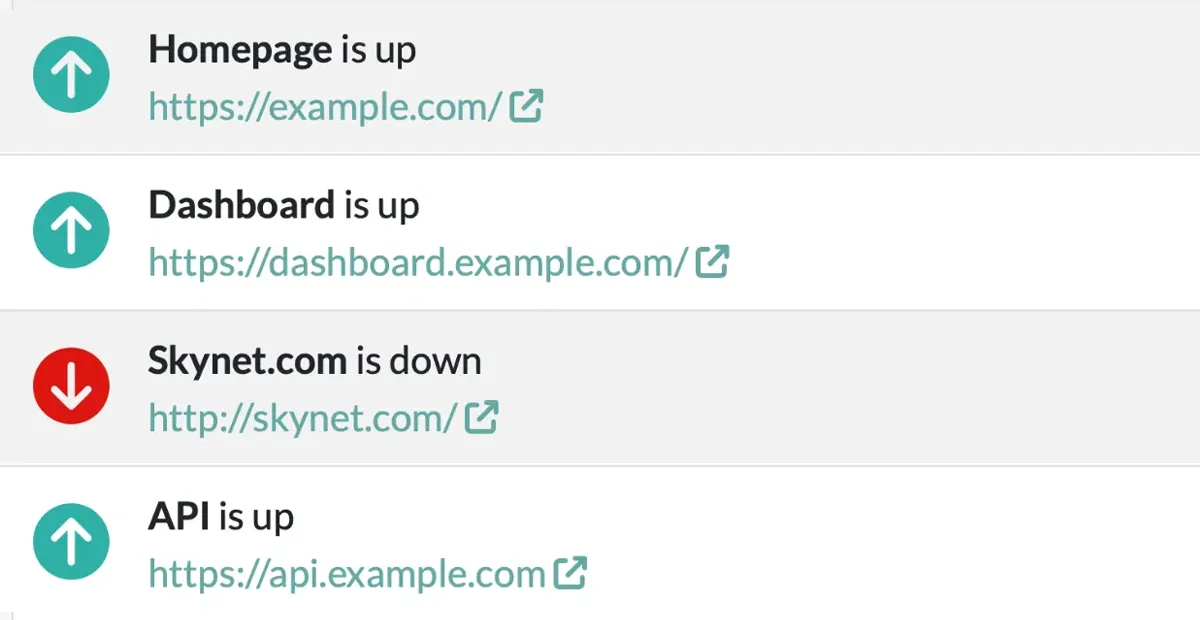
Phoenix Uptime Monitoring
Know when your Phoenix app is down before your customers do
- Instant alerts when your site goes down
- Know exactly what's broken—not just that it's down
- Wake the right person with smart escalation rules
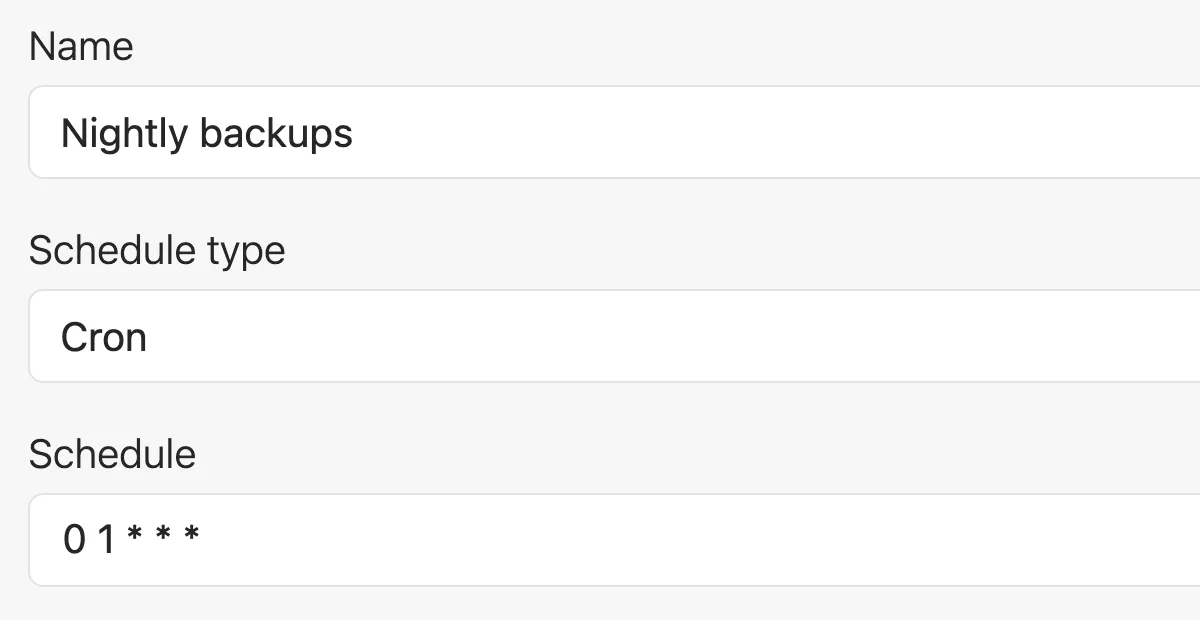
Phoenix Cron Monitoring & Heartbeats (Check-ins)
Make sure your background jobs and tasks run on time
- Alerts you when jobs fail or don't run at all
- Tracks success rates and execution over time
- Simple heartbeat API works with any stack
Phoenix Status Pages
Keep your customers informed during an outage
- Automatically updates when issues are detected
- Reduces support tickets during incidents
- Professional status page with your domain and branding
Honeybadger works where you do

Frequently Asked Questions
Got questions? We've got answers. Here are some common questions about Honeybadger for Phoenix:
How does Honeybadger integrate with Phoenix?
Honeybadger integrates seamlessly with Phoenix through our official Hex package. The honeybadger package automatically captures unhandled exceptions in controllers, crashed Elixir processes, background jobs, and more. The integration includes:
- Automatic exception tracking
- Request context and parameters
- Logs and performance metrics/telemetry
- Deep integrations with popular Elixir libraries like LiveView, Oban, Absinthe, and more
See our Phoenix integration guide for more details.
What kind of application performance monitoring data does Honeybadger collect?
Honeybadger collects comprehensive performance data including:
- Request/response cycles
- Database queries
- View rendering
- Background job execution
- HTTP client requests
- Phoenix LiveView life-cycle events
- Events and metrics for Oban, Absinthe, Ecto, and more
For full details, see our documentation for Phoenix performance monitoring.
Does Honeybadger support Phoenix LiveView monitoring?
Yes, we support Phoenix LiveView monitoring! Honeybadger automatically monitors the Phoenix LiveView life-cycle and provides the following information:
- Life-cycle events including
handle_eventandmount - View names and parameters
- Event counts and metrics
- LiveView event execution and mount performance
See our documentation for Elixir performance monitoring for more details.
How does Honeybadger impact the performance of my app?
Honeybadger does not impact your application’s performance. That’s because we designed Honeybadger to be lightweight and efficient from the start:
- Asynchronous error reporting by default
- Well-optimized Elixir package with low memory usage
- Customizable rate limiting controls
- Background processing for logs and metrics
If you have large amounts of log data to send us, you can also take advantage of our syslog, Vector, or PaaS integrations.
What's the difference between logging, performance monitoring, and error tracking?
These are three distinct but complementary aspects of application monitoring:
Error Tracking focuses on capturing and managing exceptions and errors in your application. It helps you identify when and why your application fails and which users are affected, with detailed stack traces, context, and debugging information. Unlike some APM tools, Honeybadger notifies you about errors as soon as they happen and groups similar errors together to reduce notification fatigue.
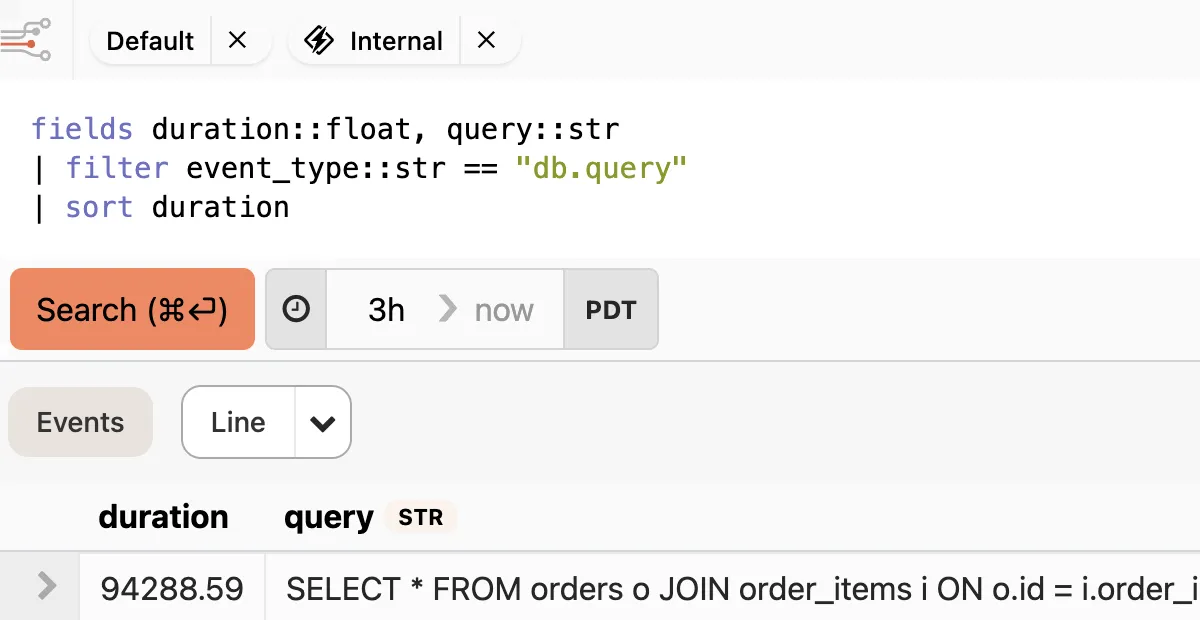
Application Performance Monitoring (APM) tracks how your application performs over time, measuring metrics like response times, throughput, and resource utilization. It helps identify bottlenecks and optimize application speed. Honeybadger captures performance telemetry, which we use to power our automated dashboards. A key difference between Honeybadger and other APM tools is that we also give you direct access to the raw structured data in Honeybadger Insights, which is super powerful.
Logging provides a chronological record of events and messages in your application. It’s useful for debugging, auditing, and understanding the flow of your application. In Honeybadger, logs are stored as structured events. While you can send any kind of log to Honeybadger, structured logging unlocks the full power of Honeybadger Insights, which allows you to query, transform, and visualize your data in real-time.
While each serves a different purpose, they work together to give you a complete picture of your application’s health. Honeybadger provides tools for all three, and best of all, they’re deeply integrated with each other to help you understand and fix issues faster.
Can I customize error notifications?
Yes! Honeybadger offers flexible notification options:
- Email notifications with customizable templates
- Integration with Slack, Microsoft Teams, and Discord
- Webhook support for custom integrations
- Custom notification rules based on error type or environment
- Intelligent grouping and rate limiting to prevent notification fatigue
See our alerts & integrations docs for more details.
What frontend languages does Honeybadger support?
Honeybadger provides comprehensive frontend error tracking support:
- JavaScript/TypeScript with support for all major frameworks (React, Vue, Angular)
- Source map support for minified code
- Automatic context collection (browser, OS, device info)
- Integration with popular build tools and bundlers
Check out our JavaScript documentation for detailed setup instructions and best practices.
Does Honeybadger have a free plan?
Our Developer plan is free for low-traffic applications and includes:
- Up to 5,000 errors per month
- 50MB/day of application logs
- Basic uptime monitoring
- Basic notifications
- 1 status page
- Community support
See our detailed pricing to learn more about our plans.
How much does Honeybadger cost?
Honeybadger offers flexible pricing plans to suit teams of all sizes:
- Developer plan: Free for low-traffic applications
- Team plan: Starts at $26/month for growing teams
- Business plan: Starts at $80/month for established businesses
- Enterprise plan: Custom pricing for large organizations
All paid plans include additional features like advanced integrations, priority support, and higher usage limits. View our detailed pricing or contact sales for custom enterprise solutions.
Thousands of developers love Honeybadger
But don't take our word for it. Here's what our users had to say when we asked them why they chose Honeybadger:
"The fact we can get rid of three separate services sounds perfect for our (very) small team."
"I just want to say, after 21 years of working in web development, this was the easiest signup experience I've ever had. Amazing work."
"Honeybadger's uptime monitoring, SLS/TLS validation, status page, and heartbeat features are really compelling and brilliant additions that will save me development time."
"Honeybadger fits me better. It's a simpler product, obvious how to use, and aimed at small companies who care for each customer."
"Honeybadger is the only service that doesn't look scary like I'm in the cockpit of an airplane."
"This is my second project I've implemented Honeybadger in (it really saved my butt with the first one). Going forward I'll be using Honeybadger for all my projects!"
"You guys absolutely rock. We love using Honeybadger and getting bugs squashed before users even have a chance to report them. Your integration with other tools is awesome and your support is 👌"
"Honeybadger was super simple to integrate with, really solid experience and got errors flowing through from production already."
"I set up Honeybadger for my app yesterday in like 2 minutes, and having prod errors appear on my phone within seconds is AWESOME! I love this service so far."
We made HB for you
Honeybadger cares about Phoenix developers. That's why we customized HB to give you the badass experience you deserve:
- Easy 5-minute setup
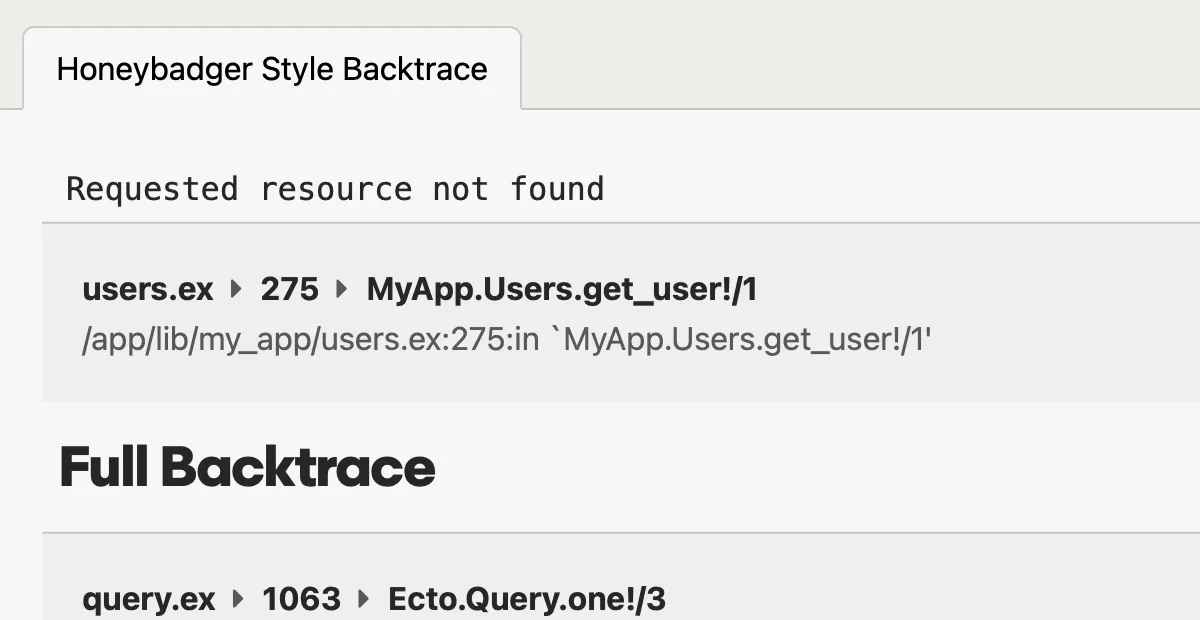
- Beautiful Elixir stack traces
- Support from the developers who built it
Honeybadger was created by developers. Because we're a bootstrapped company, we answer only to you, our customer. We frequently go above and beyond to provide an awesome experience.

"I'd be remiss if I didn't point out that every time someone here at UserTesting reaches out to you, we are dazzled by your prompt response and excellent service."
Monthly updates from the HB team
Get monitoring done.
Get real-time alerts when code breaks, monitor performance, and fix errors in record time.