Dev-friendly APM dashboards
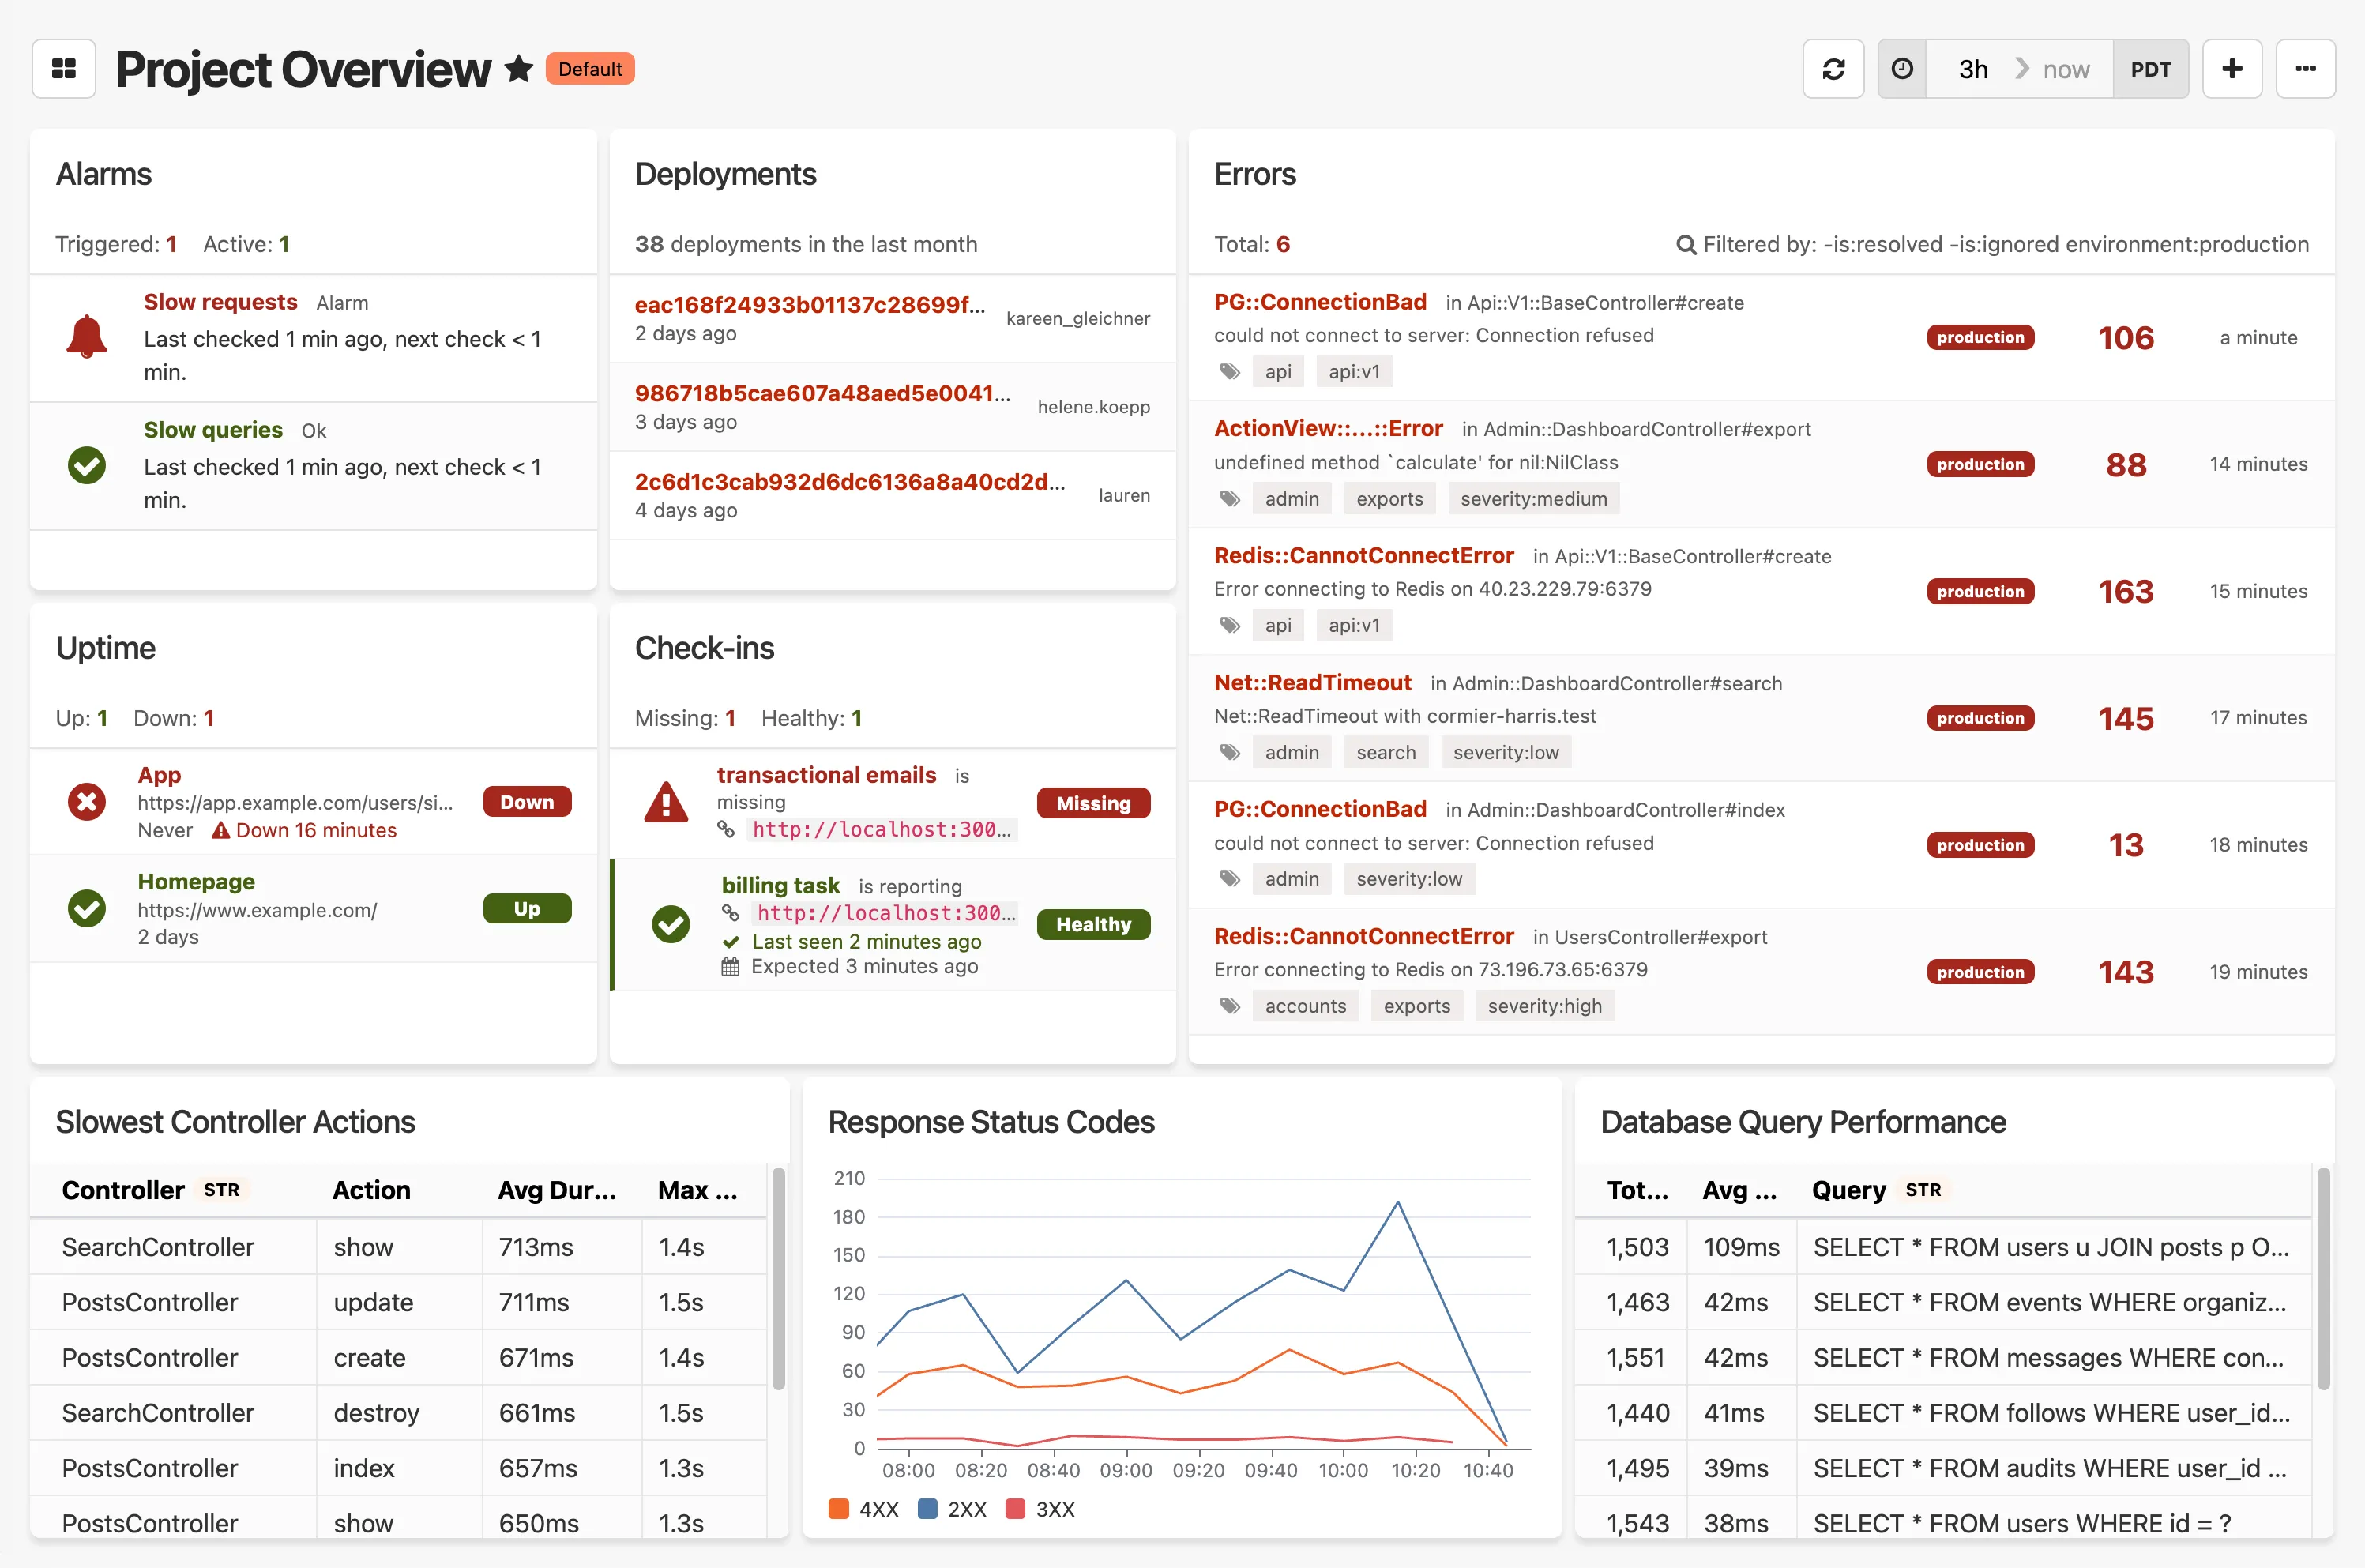
Production at a glance
All the metrics you need to monitor your apps, infrastructure, and more. None of the complexity (or cost!) that you don't. Setup in five minutes or less.
See everything that matters in one place
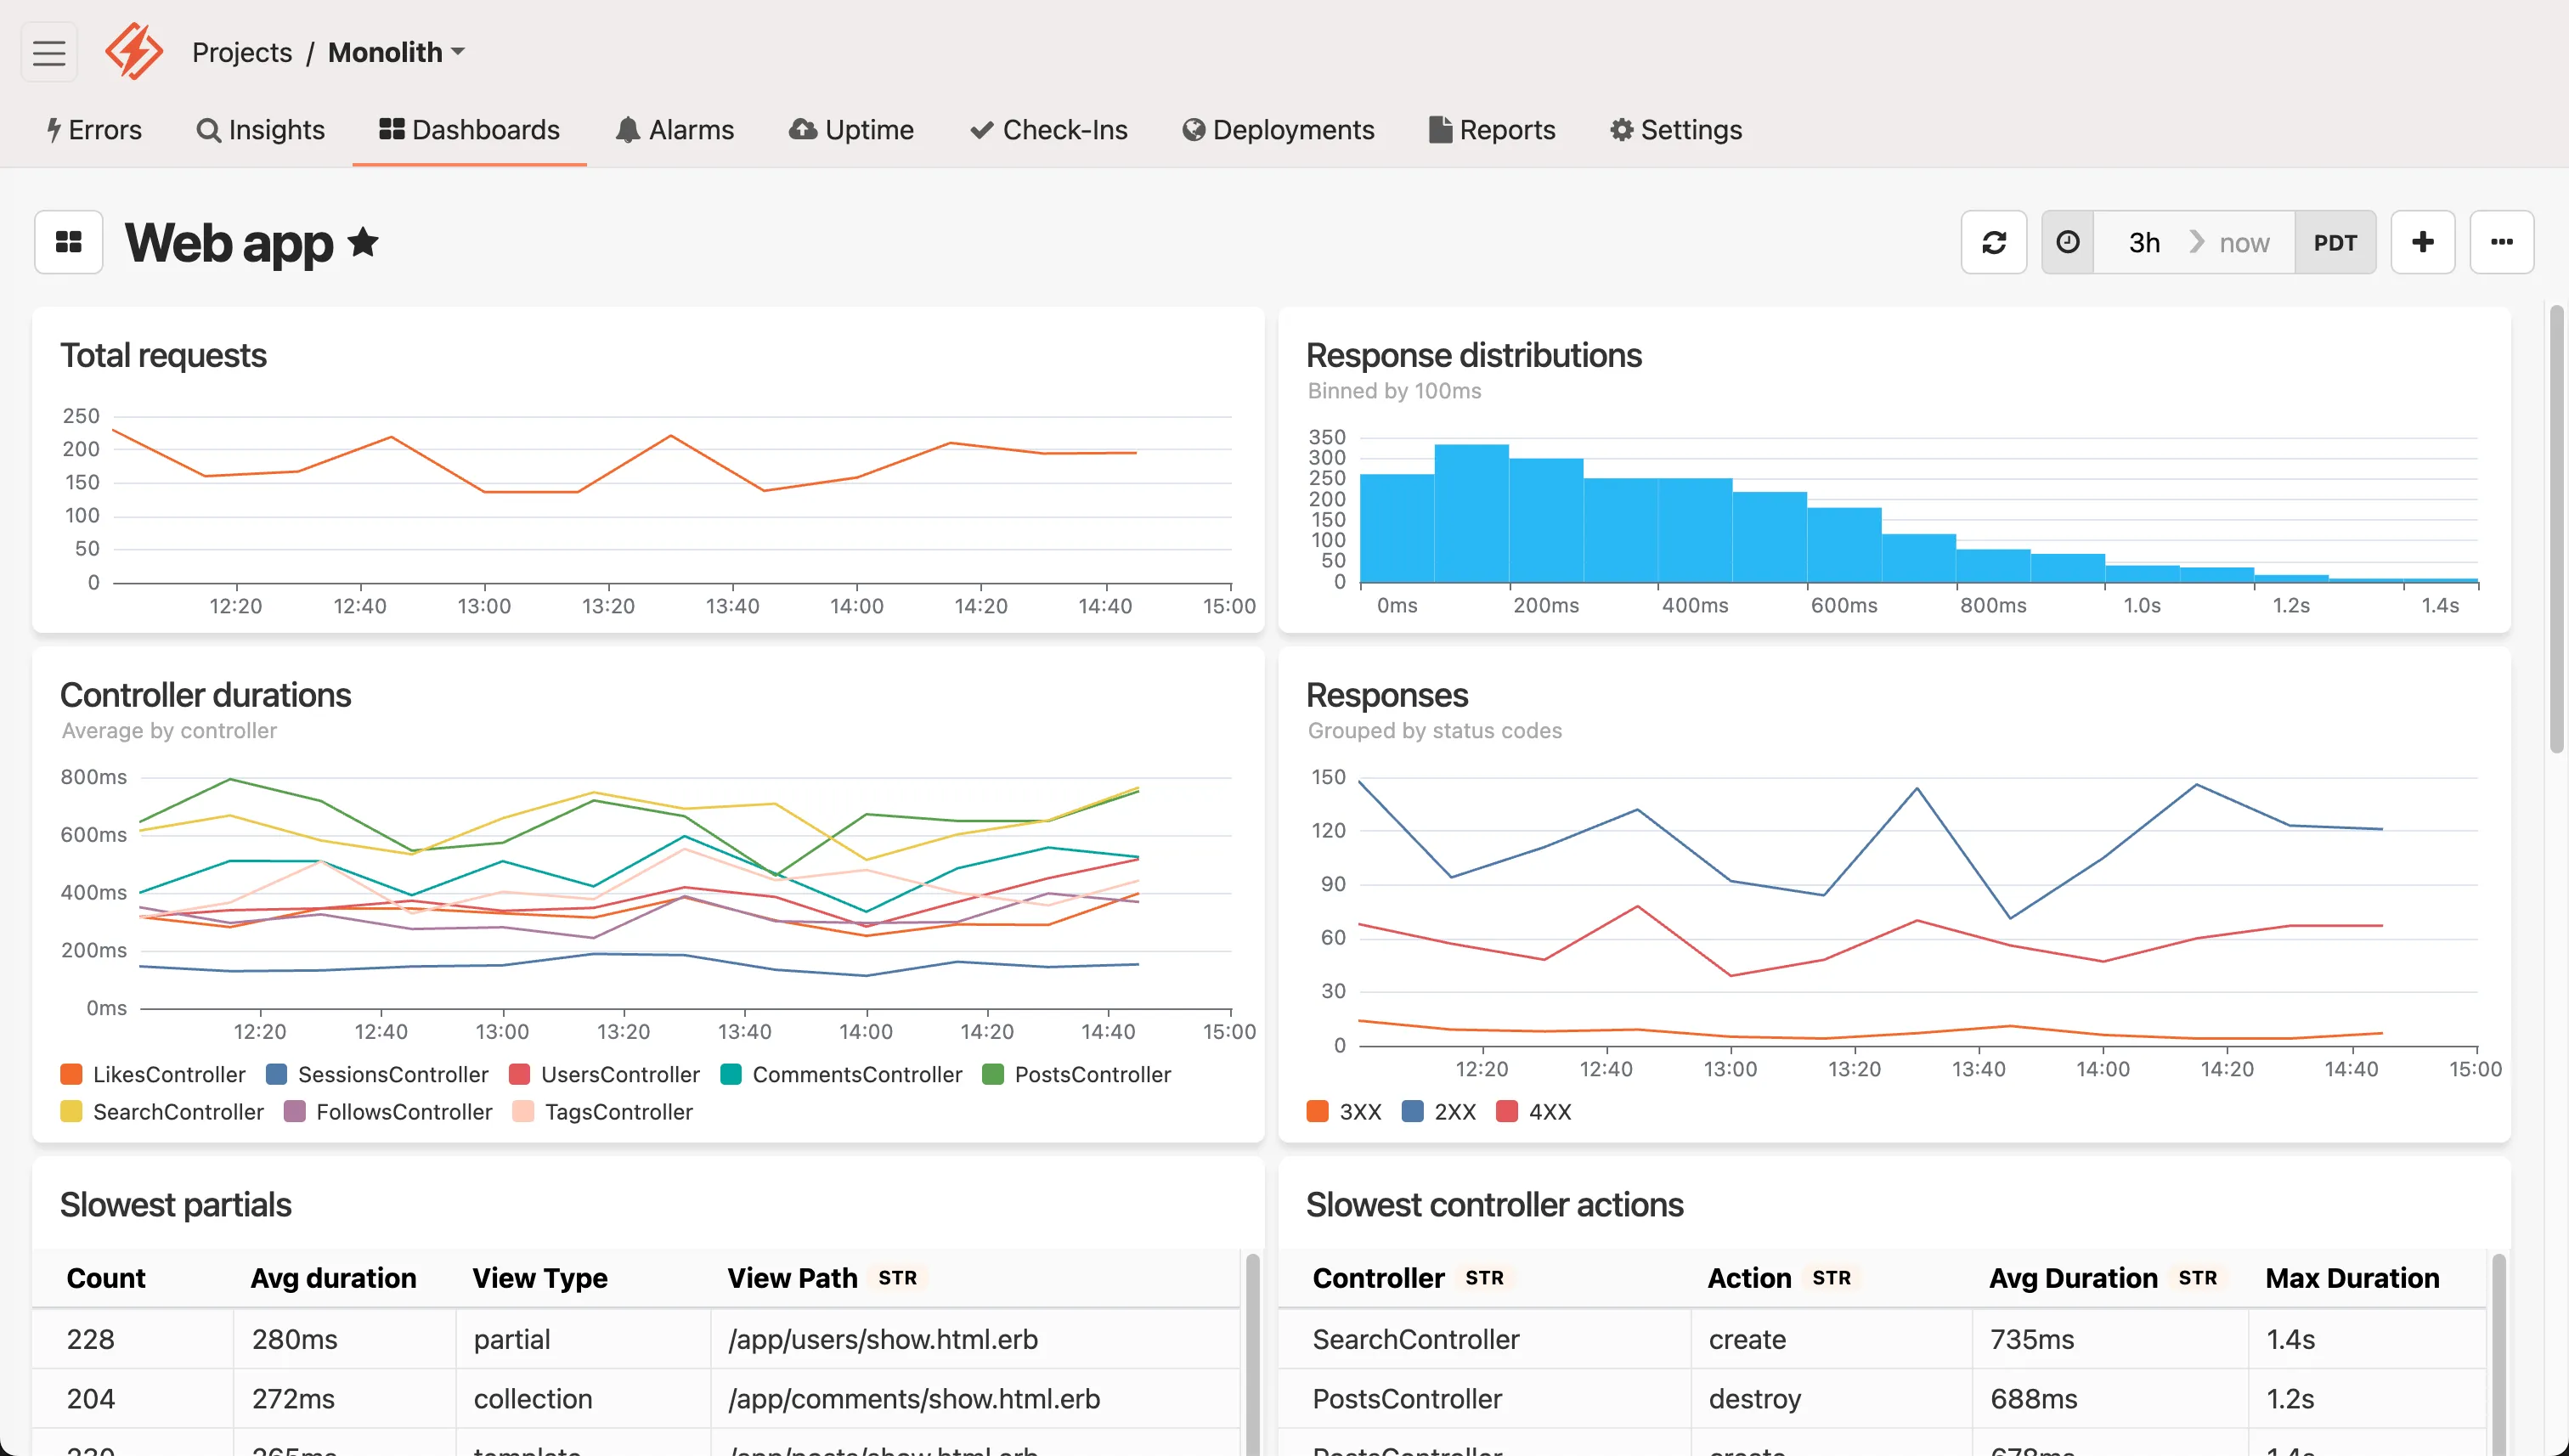
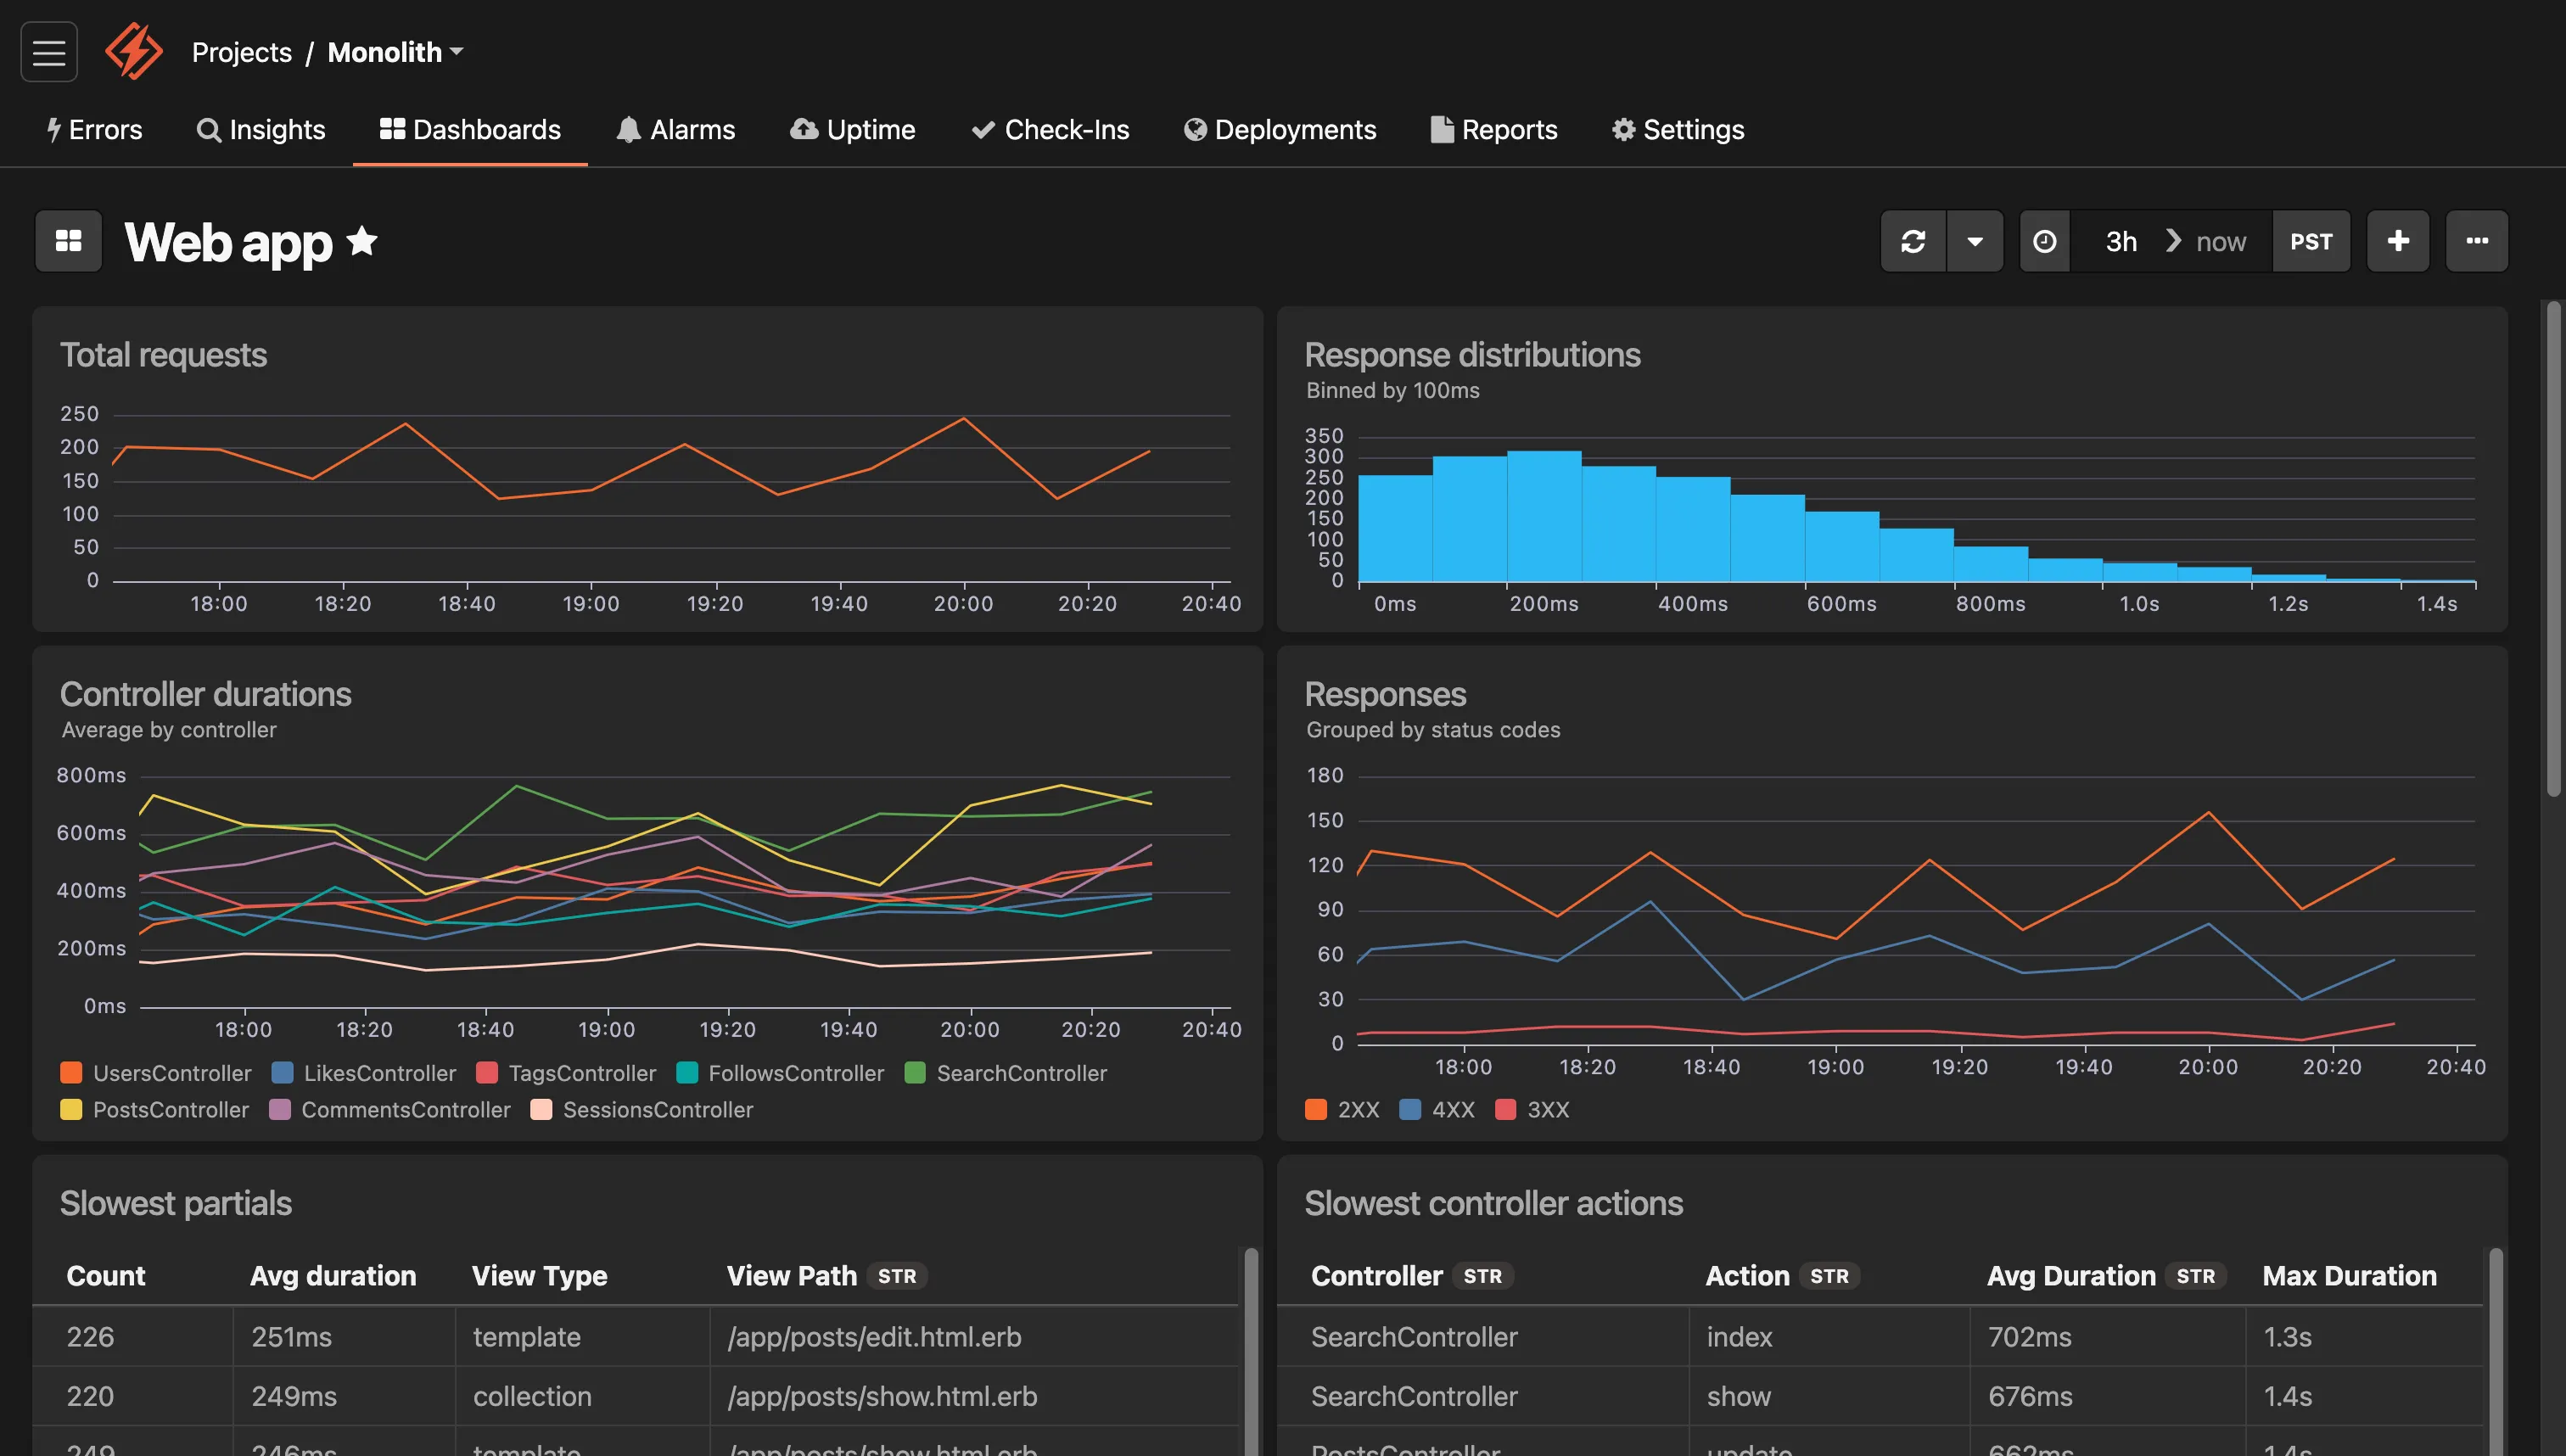
Monitor performance, infrastructure, and more. Dashboards surface critical metrics and trends, helping you spot and fix issues before they impact users.
Just Enough APM™
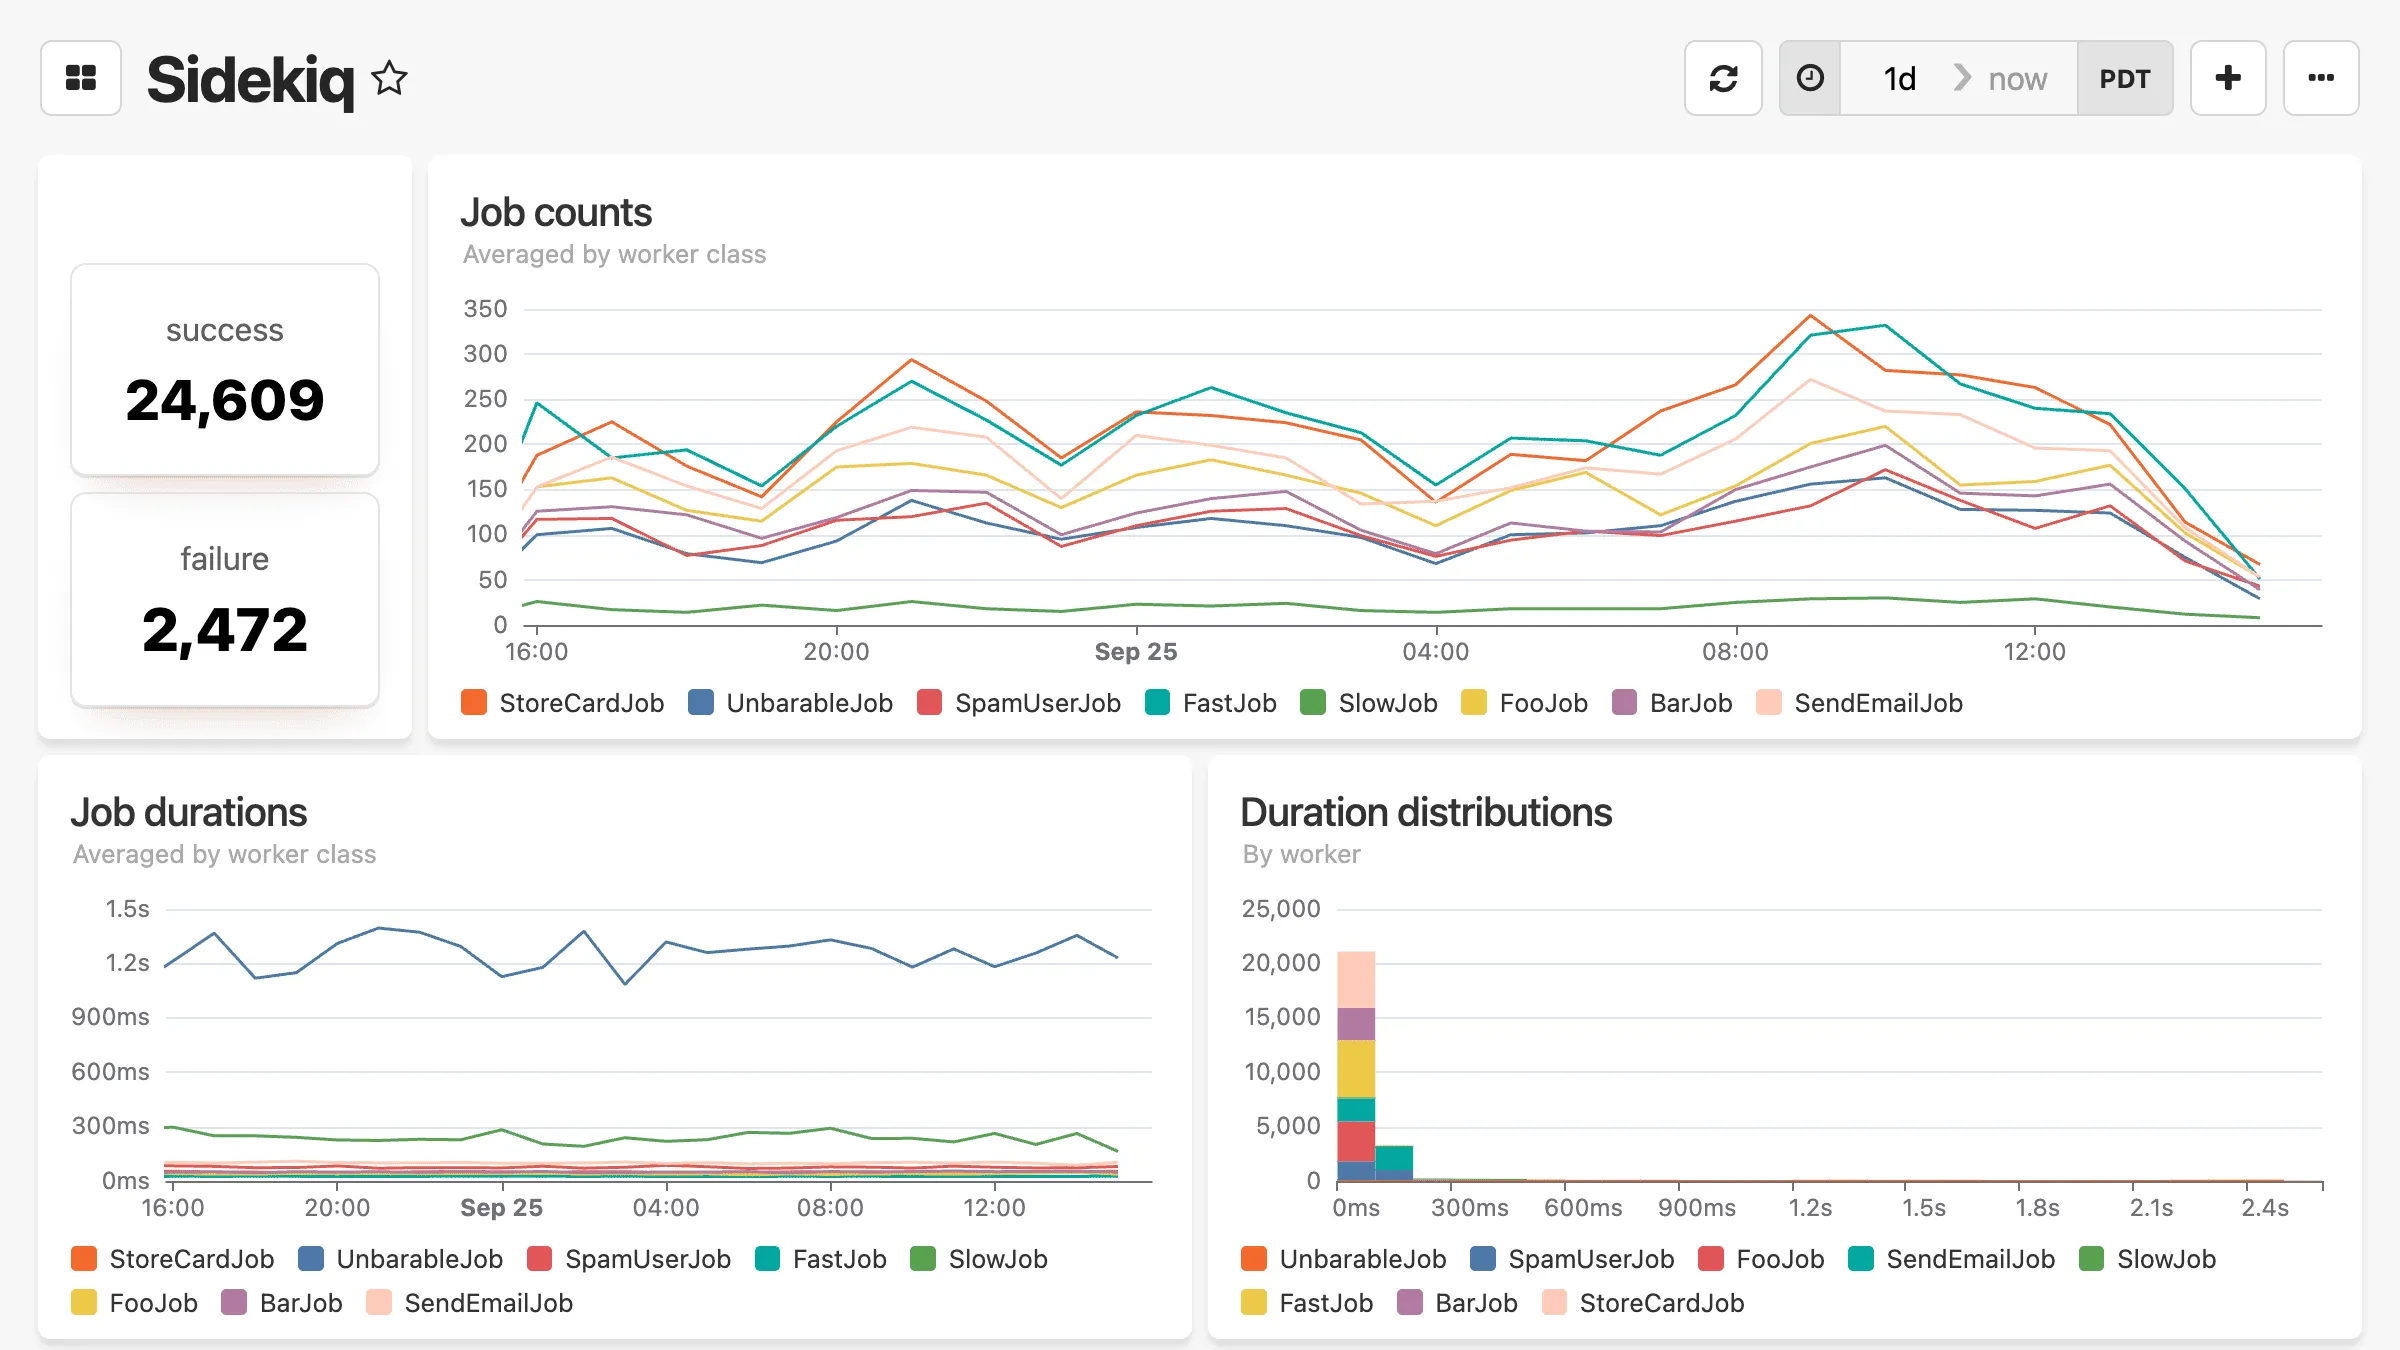
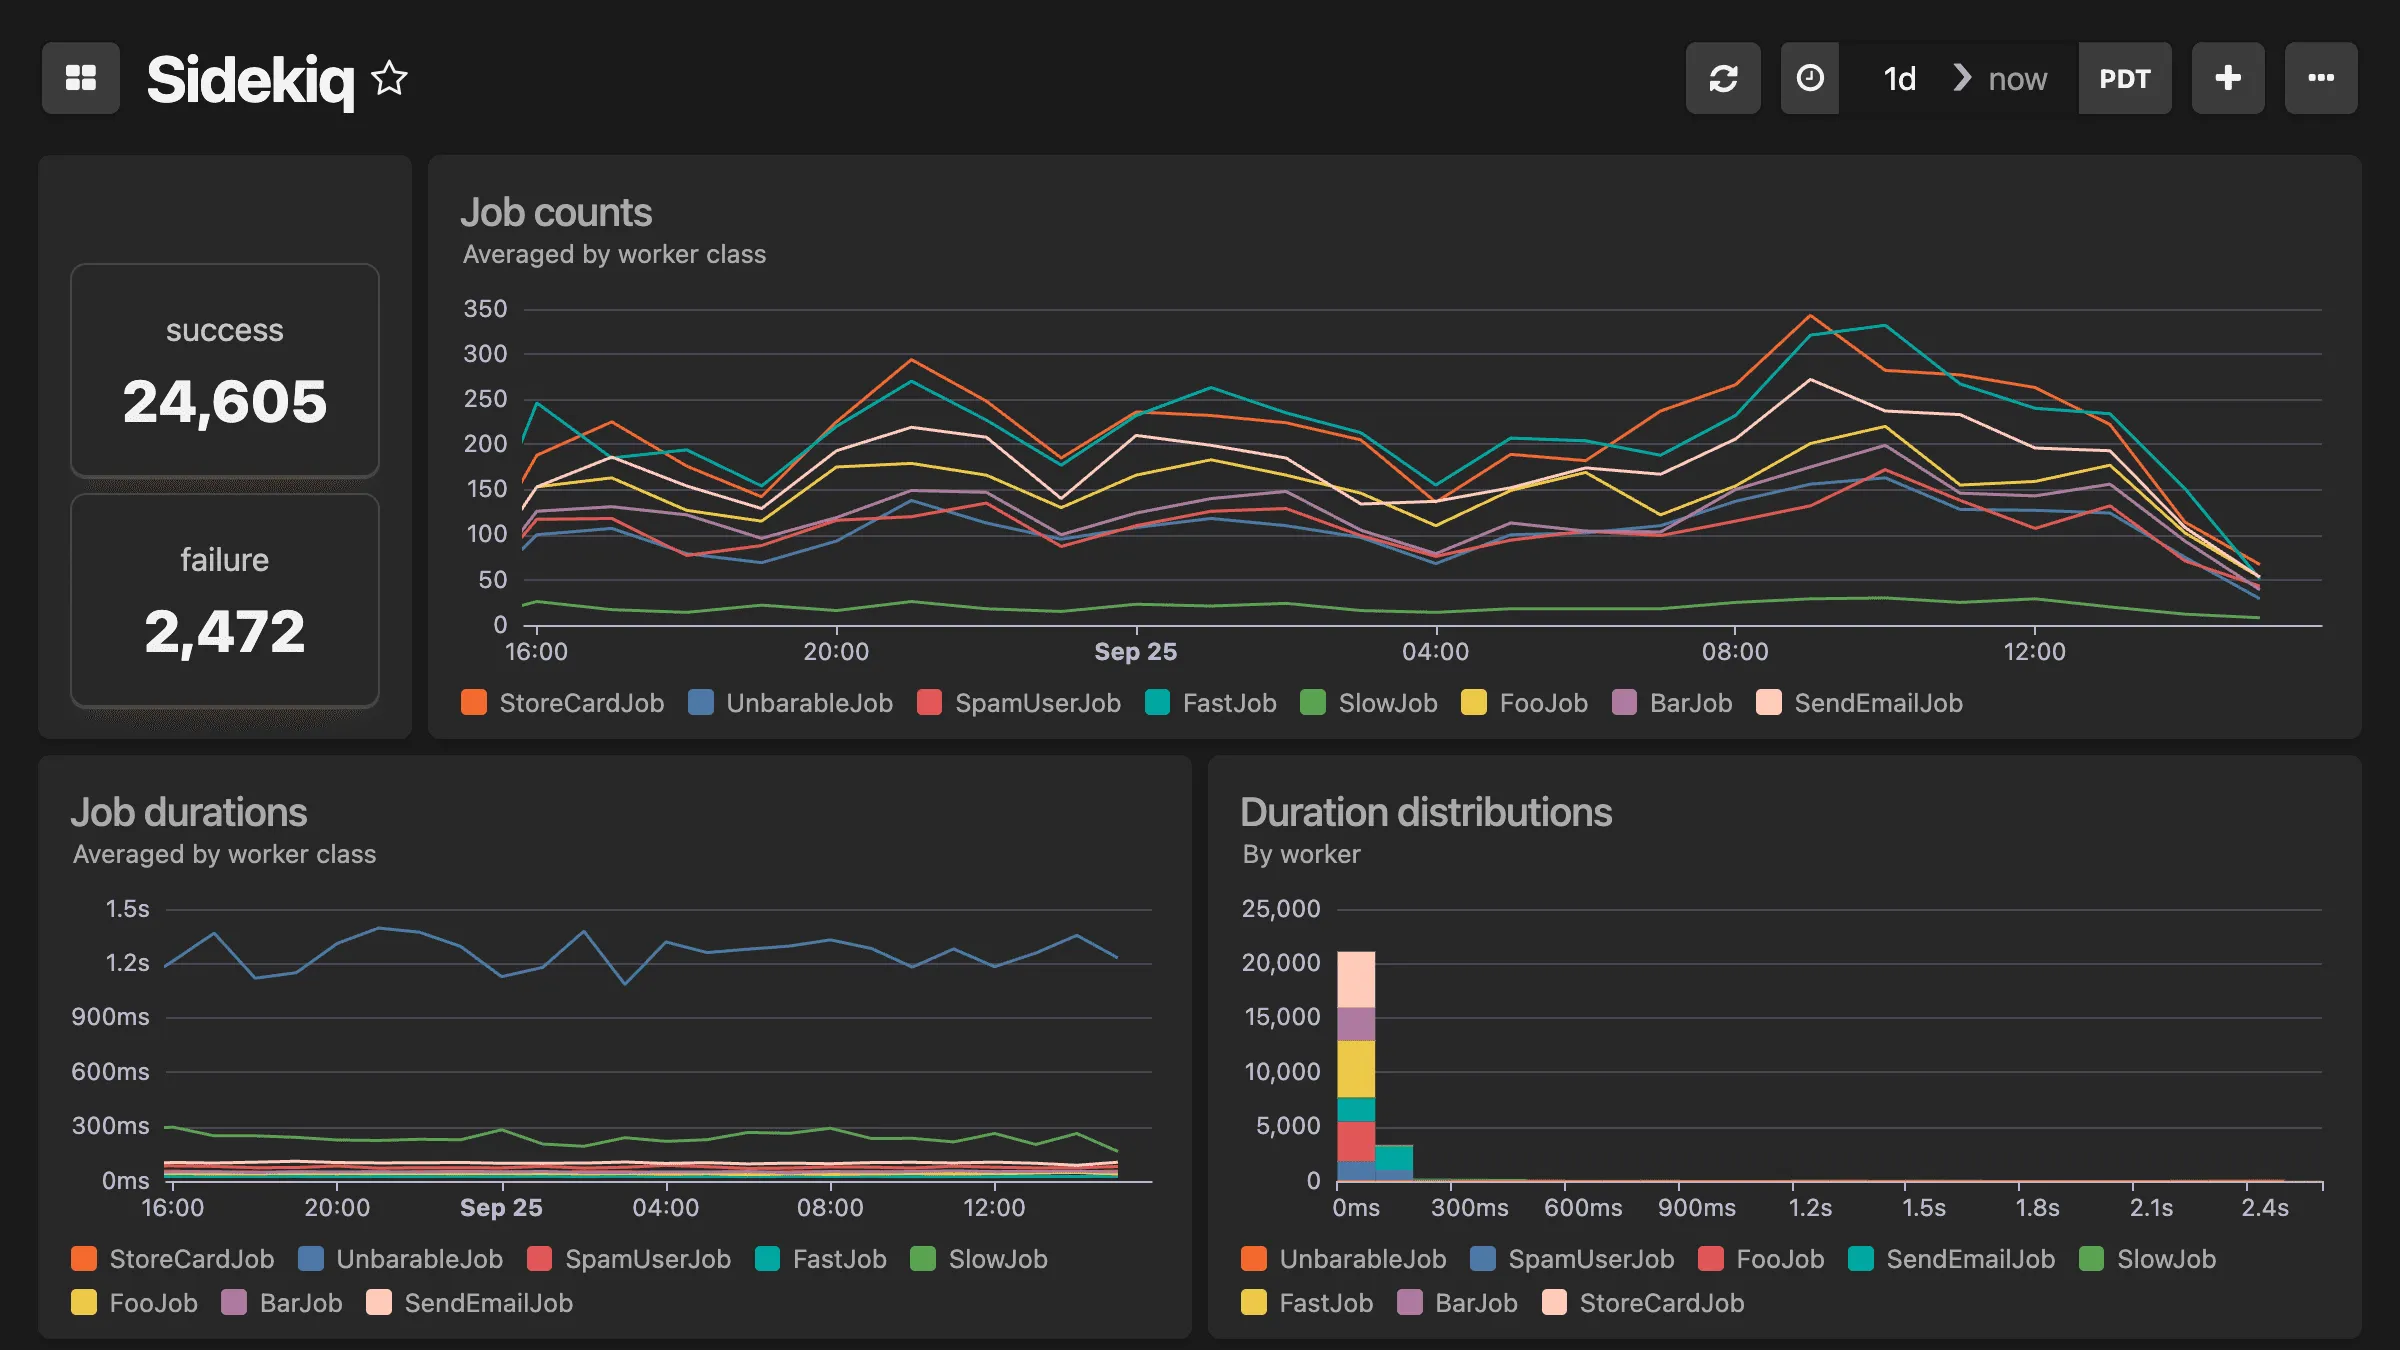
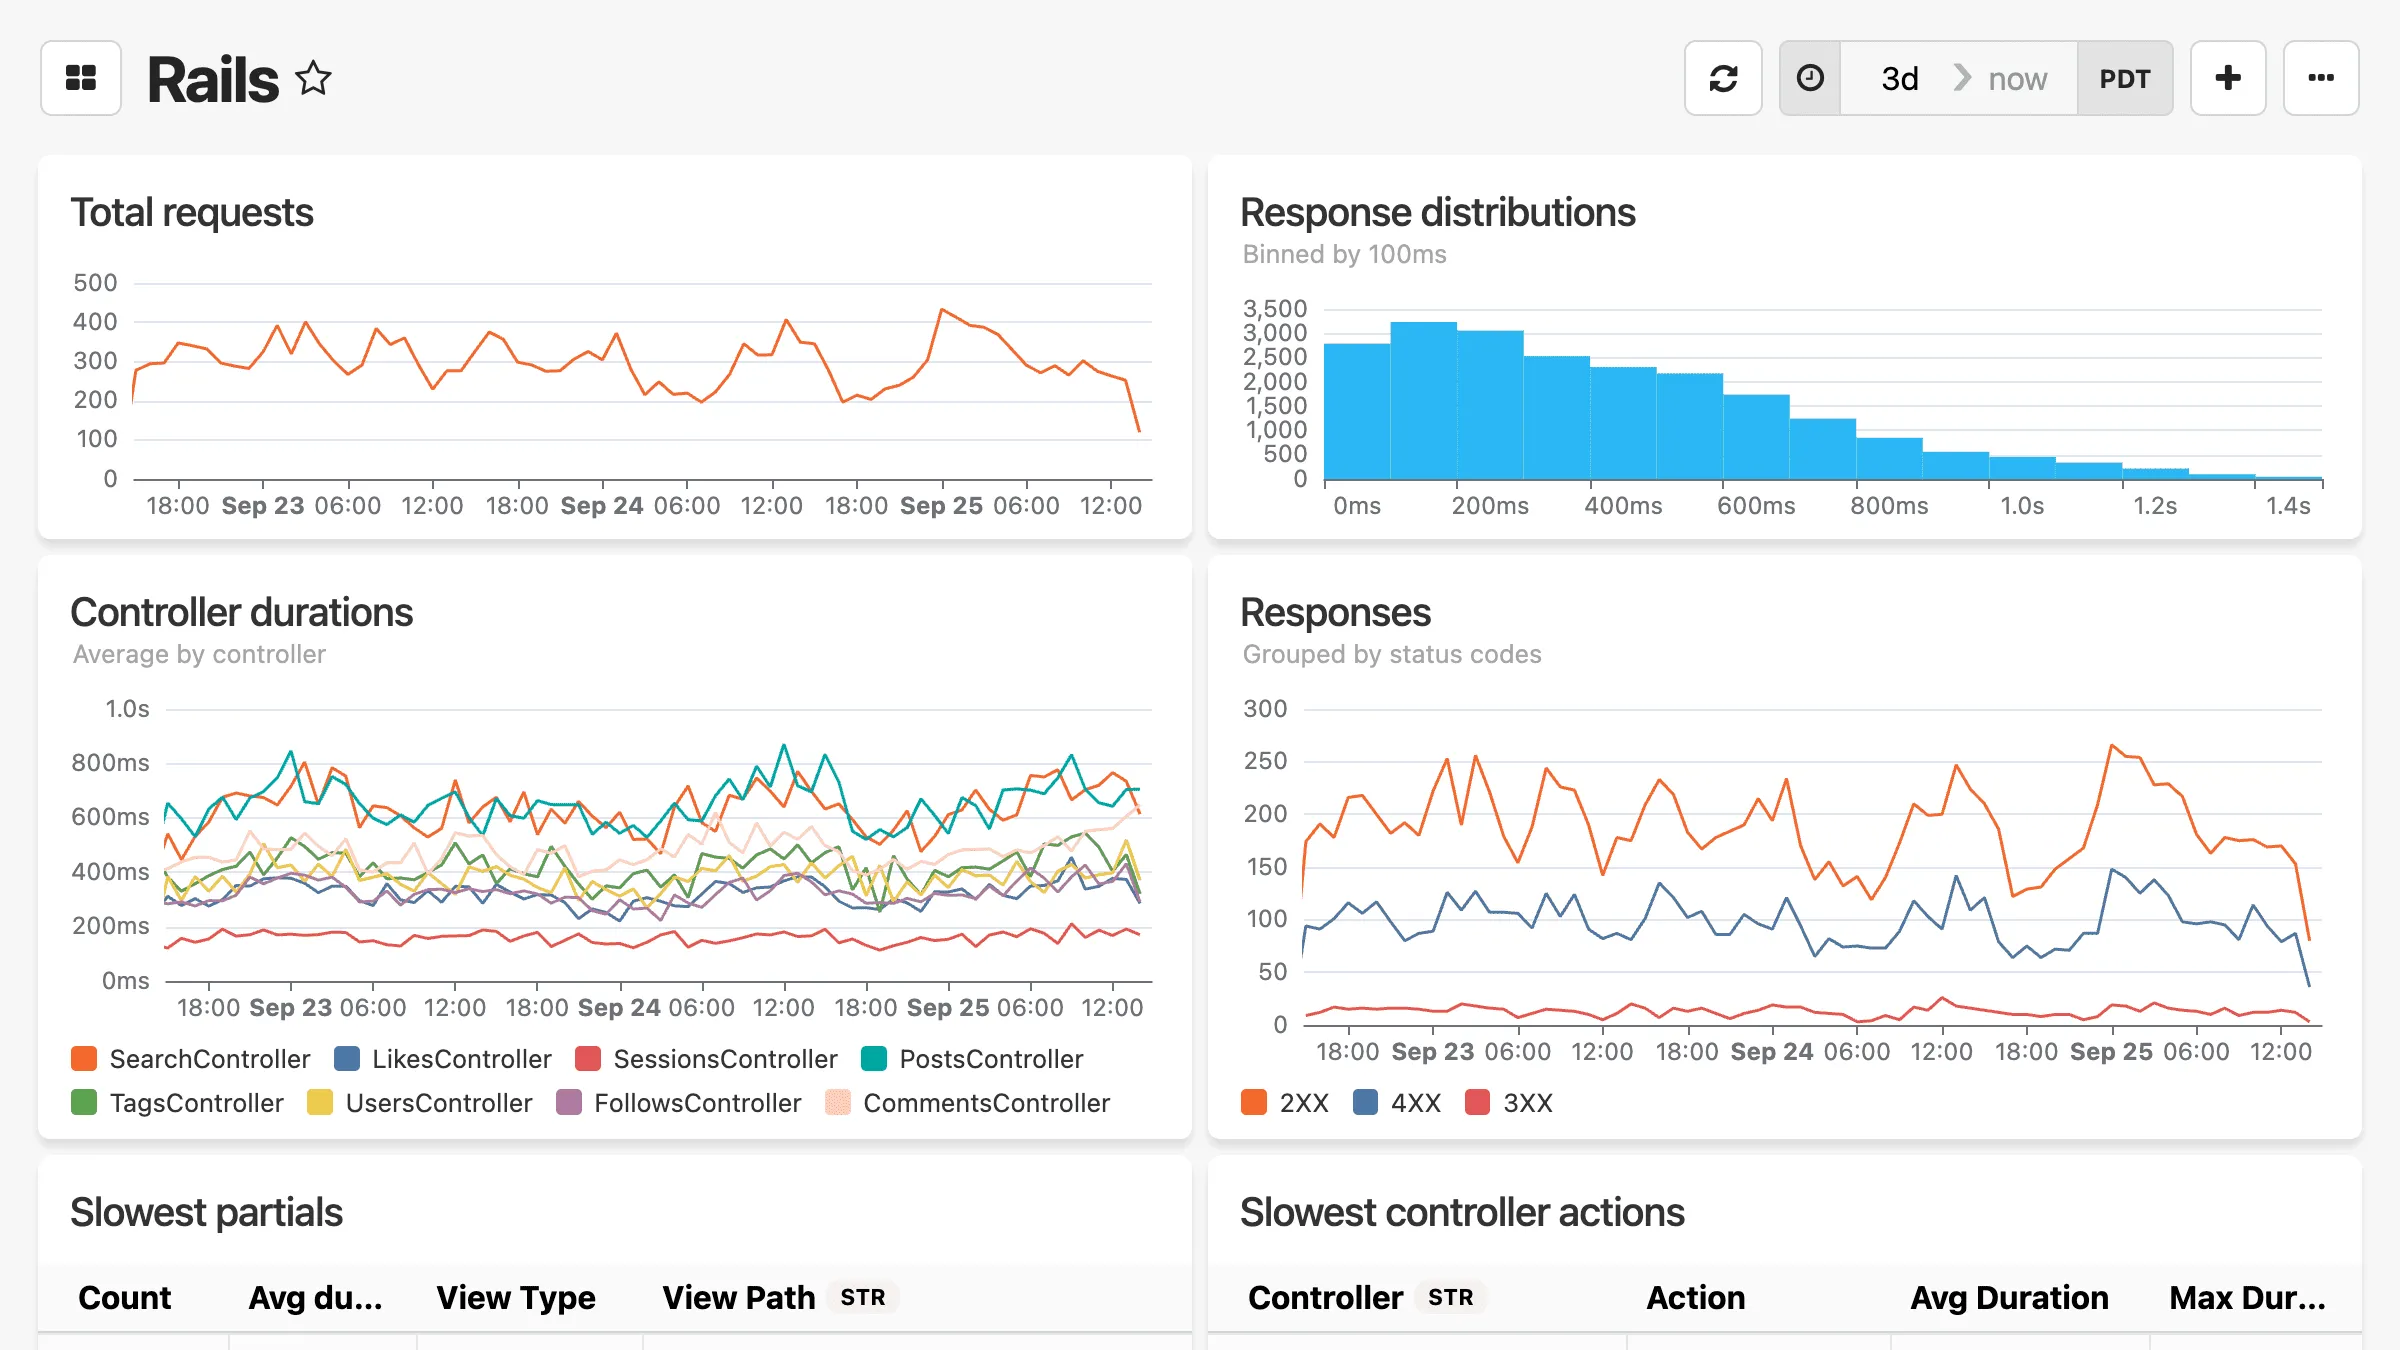
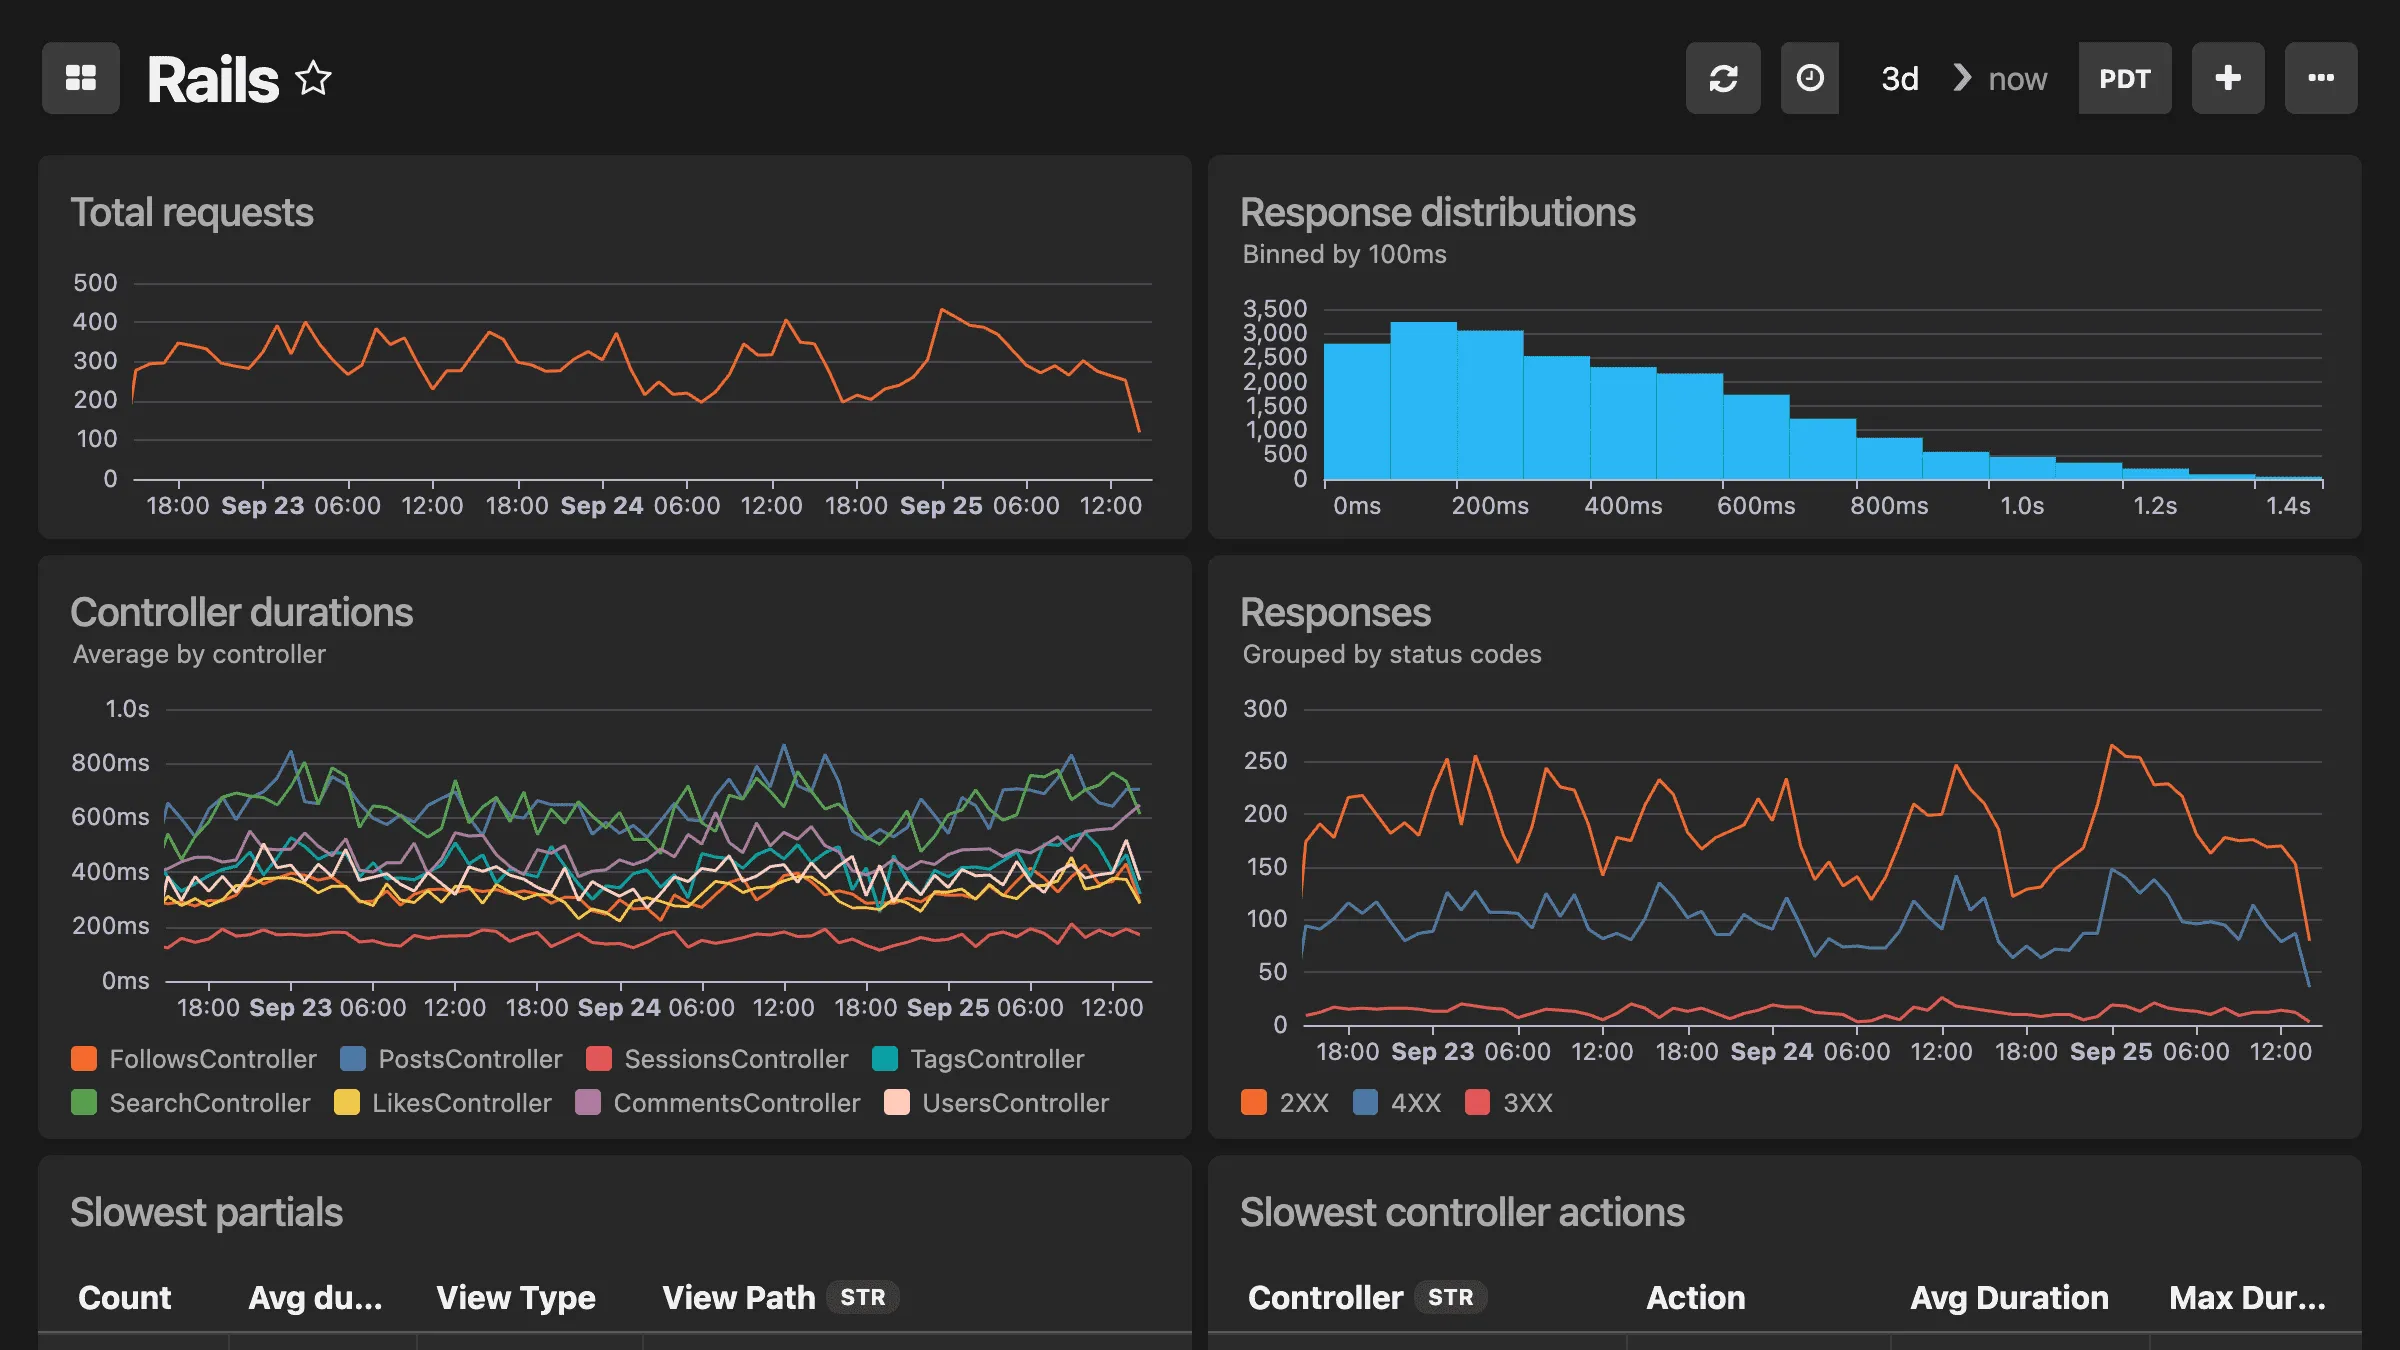
Infrastructure Monitoring
Business Metrics
Lightweight APM your team will actually use
Application Performance Monitoring is essential, but many of the APM tools on the market are bloated with features that are irrelevant for devs building and supporting apps in production.
Our APM Dashboards are a lightweight alternative to enterprise APM tools. They track the essentials automatically — response times, slow queries, background job performance — and are easy to extend and customize.
Piece of cake.
Don't worry though. If your boss or platform team insists, we play well with New Relic and Datadog.
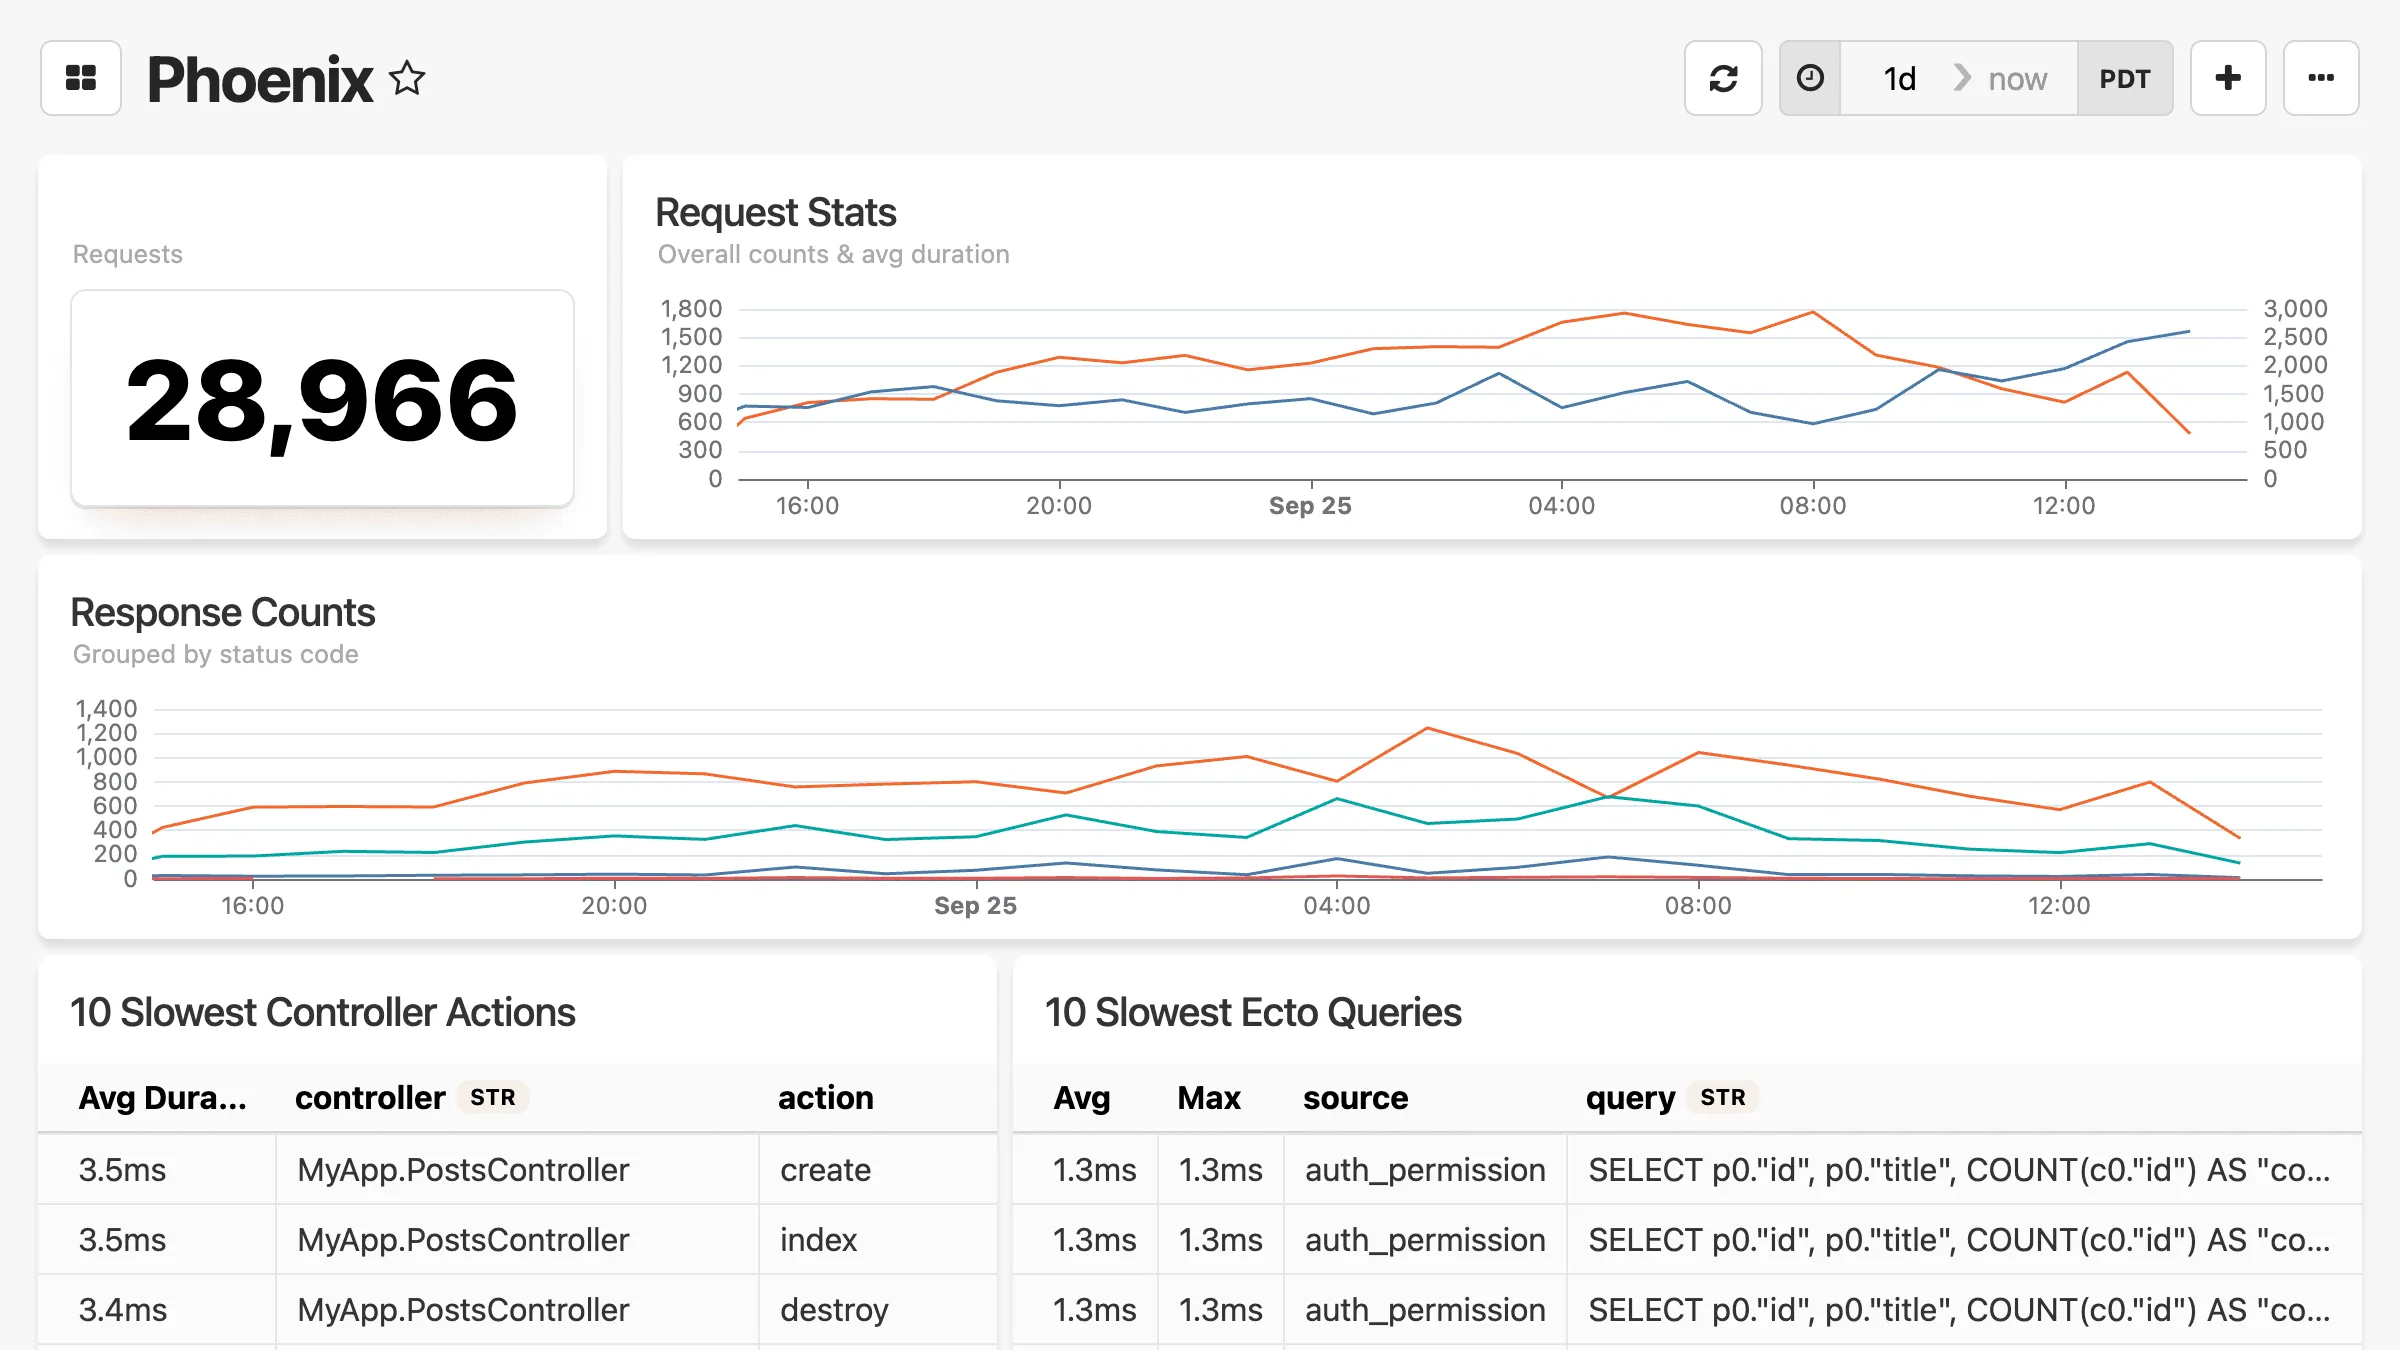
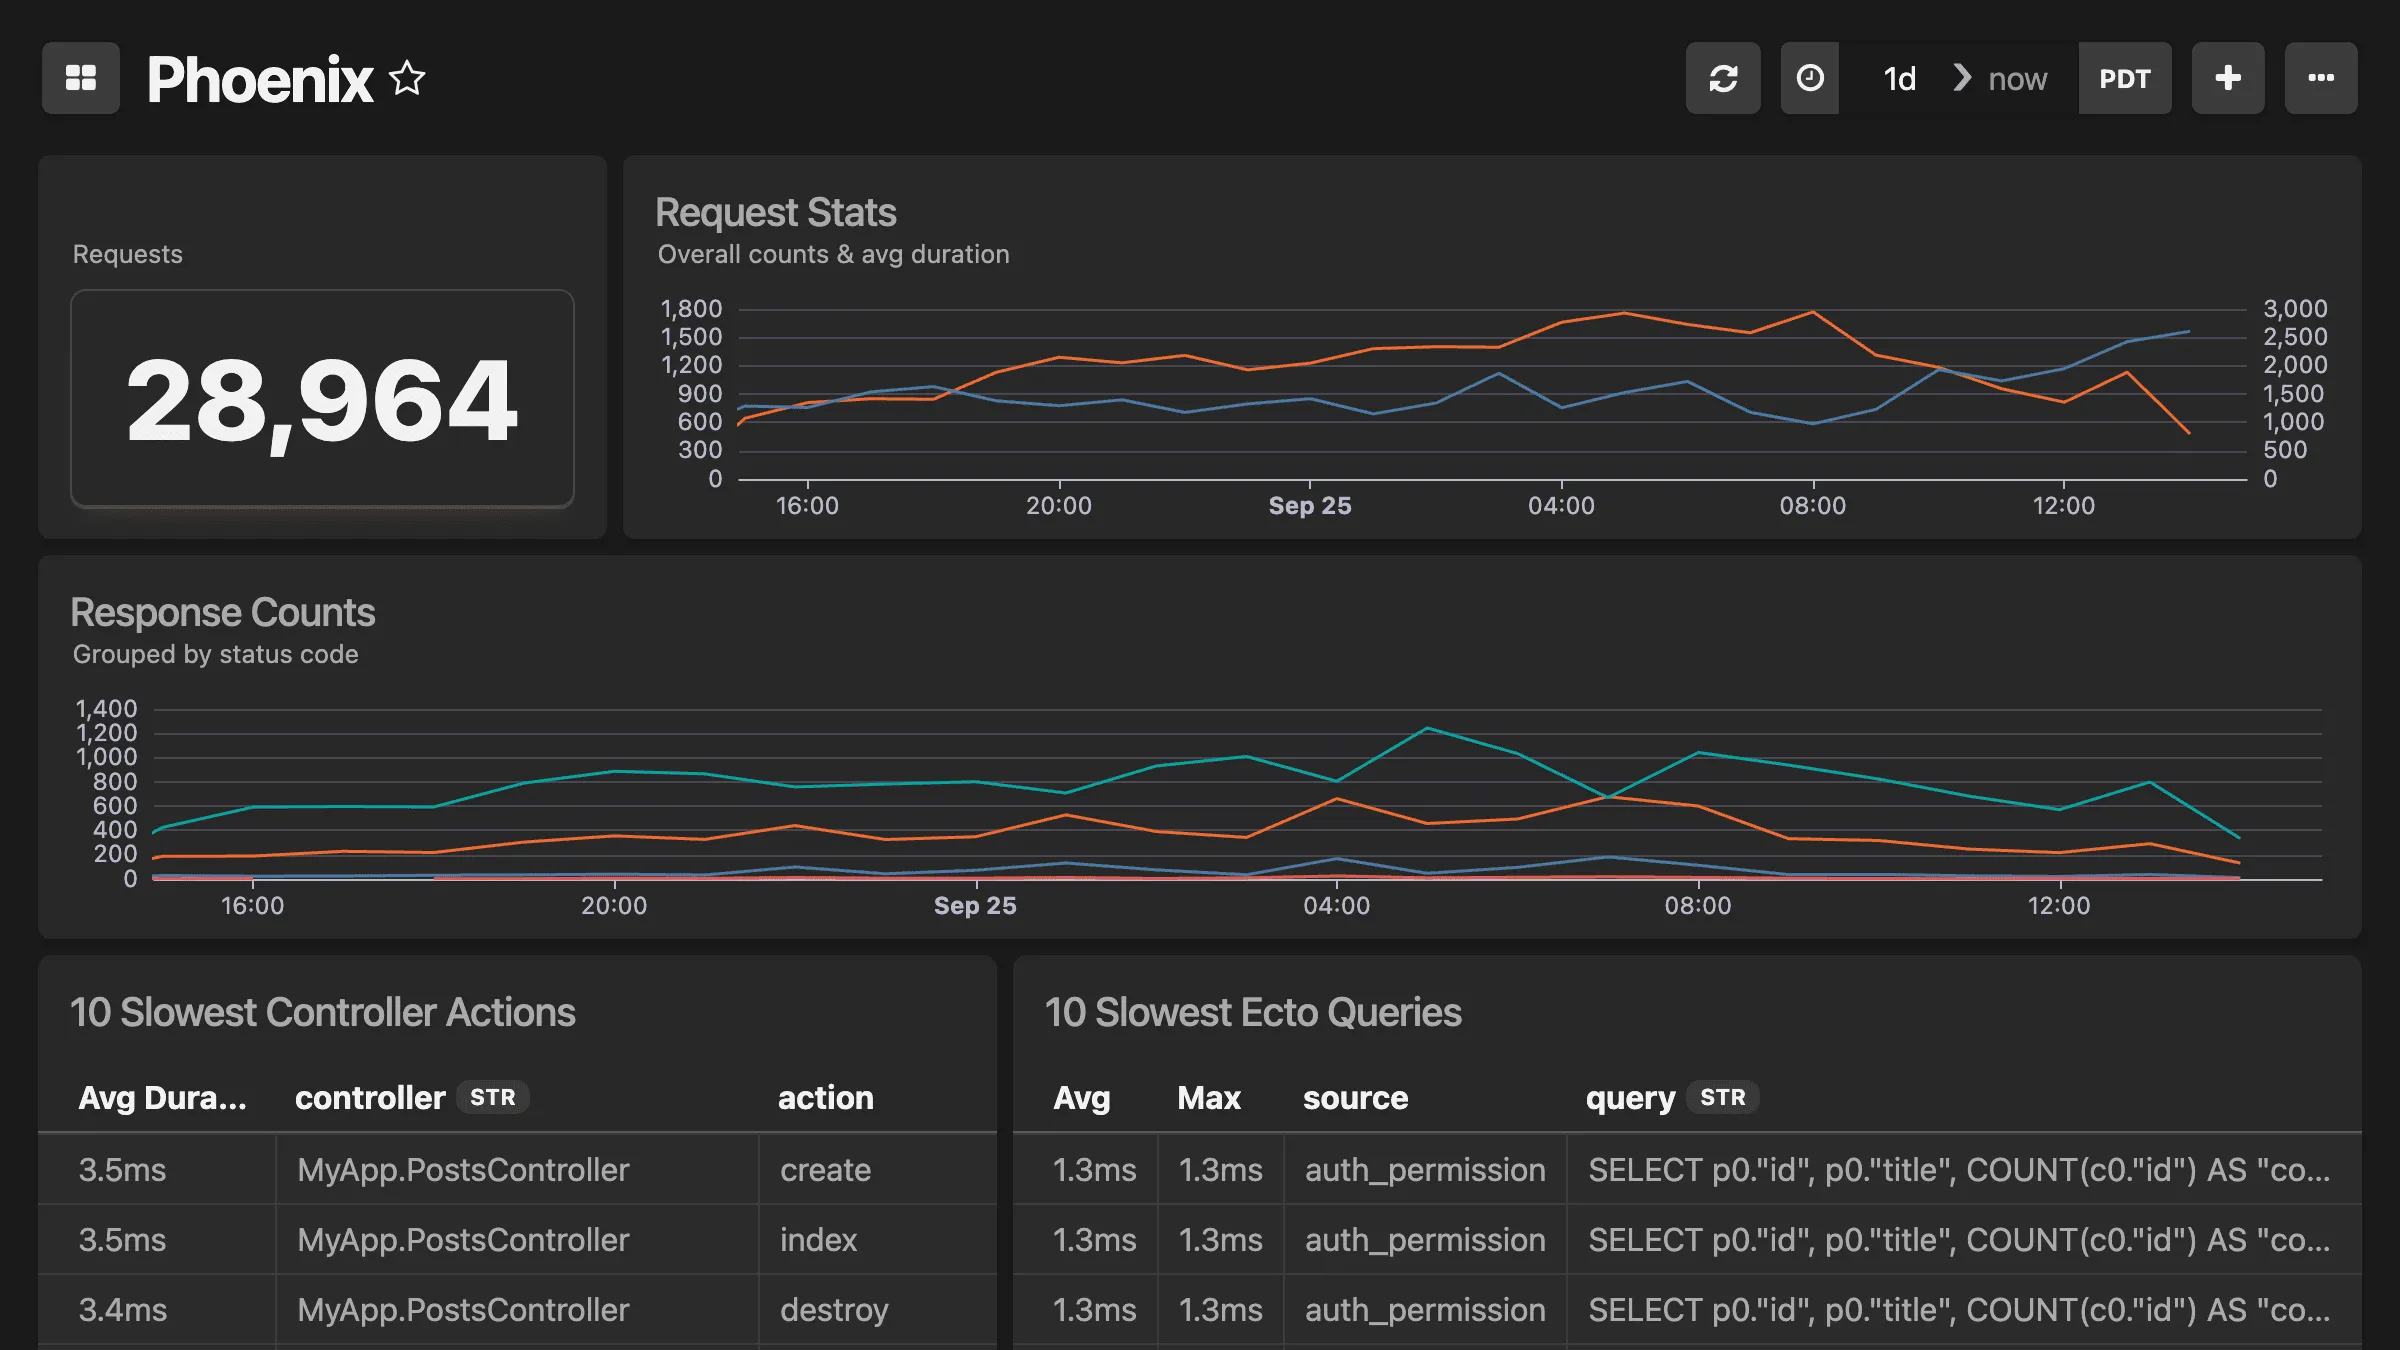
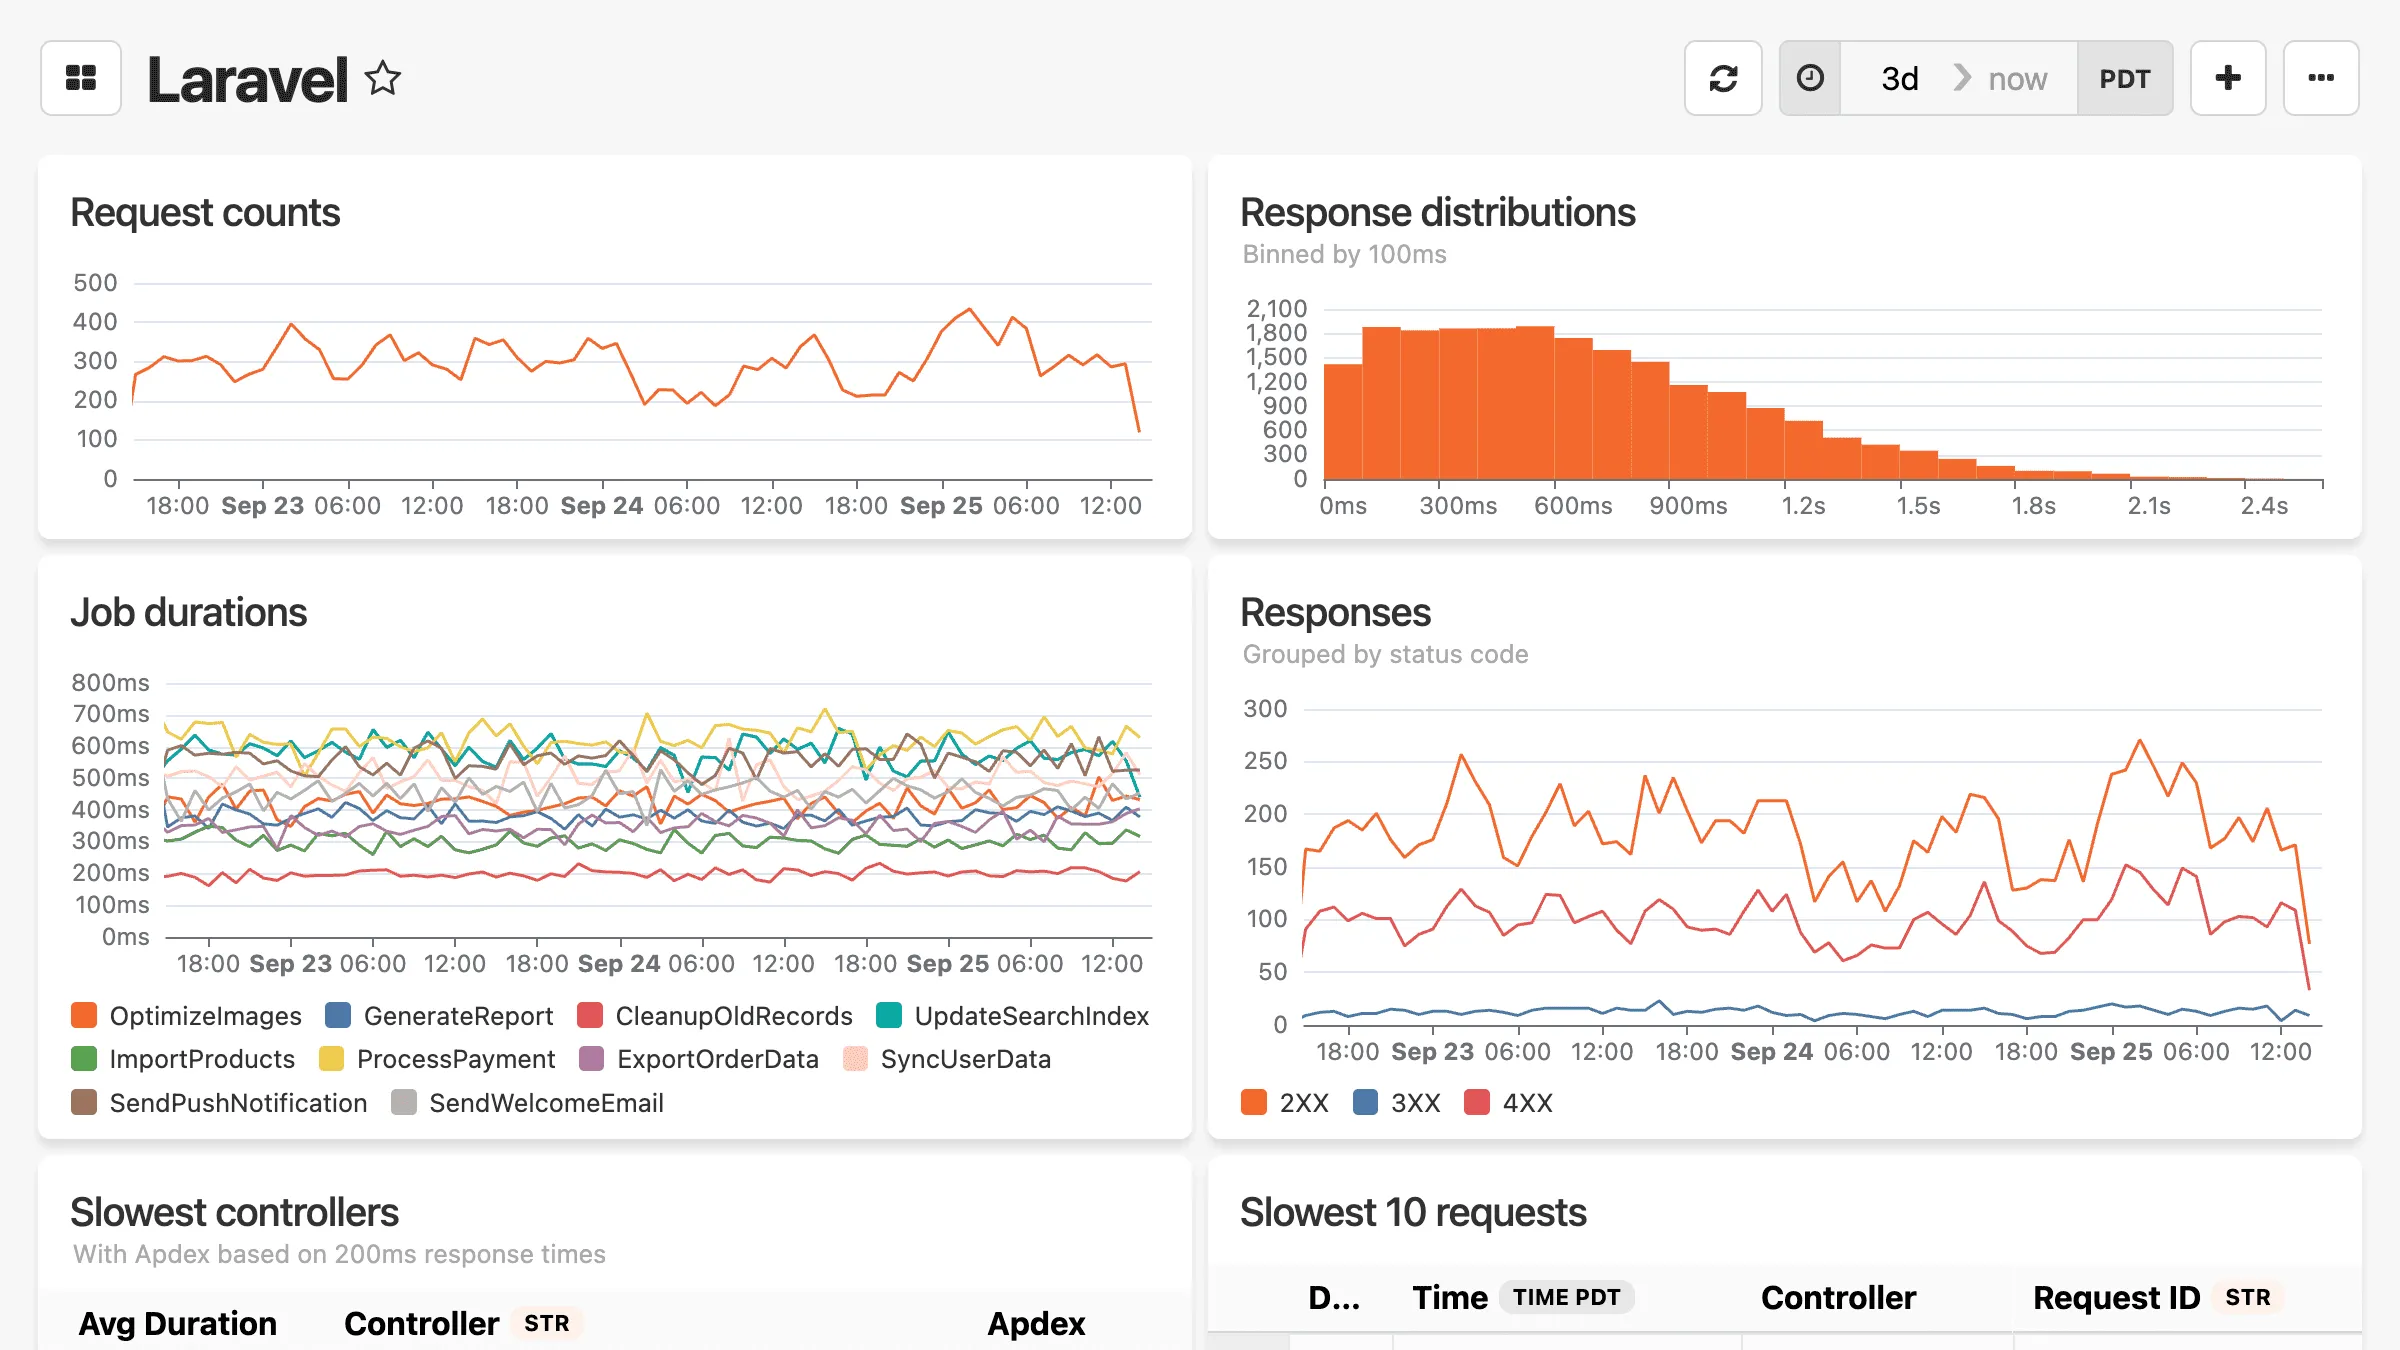
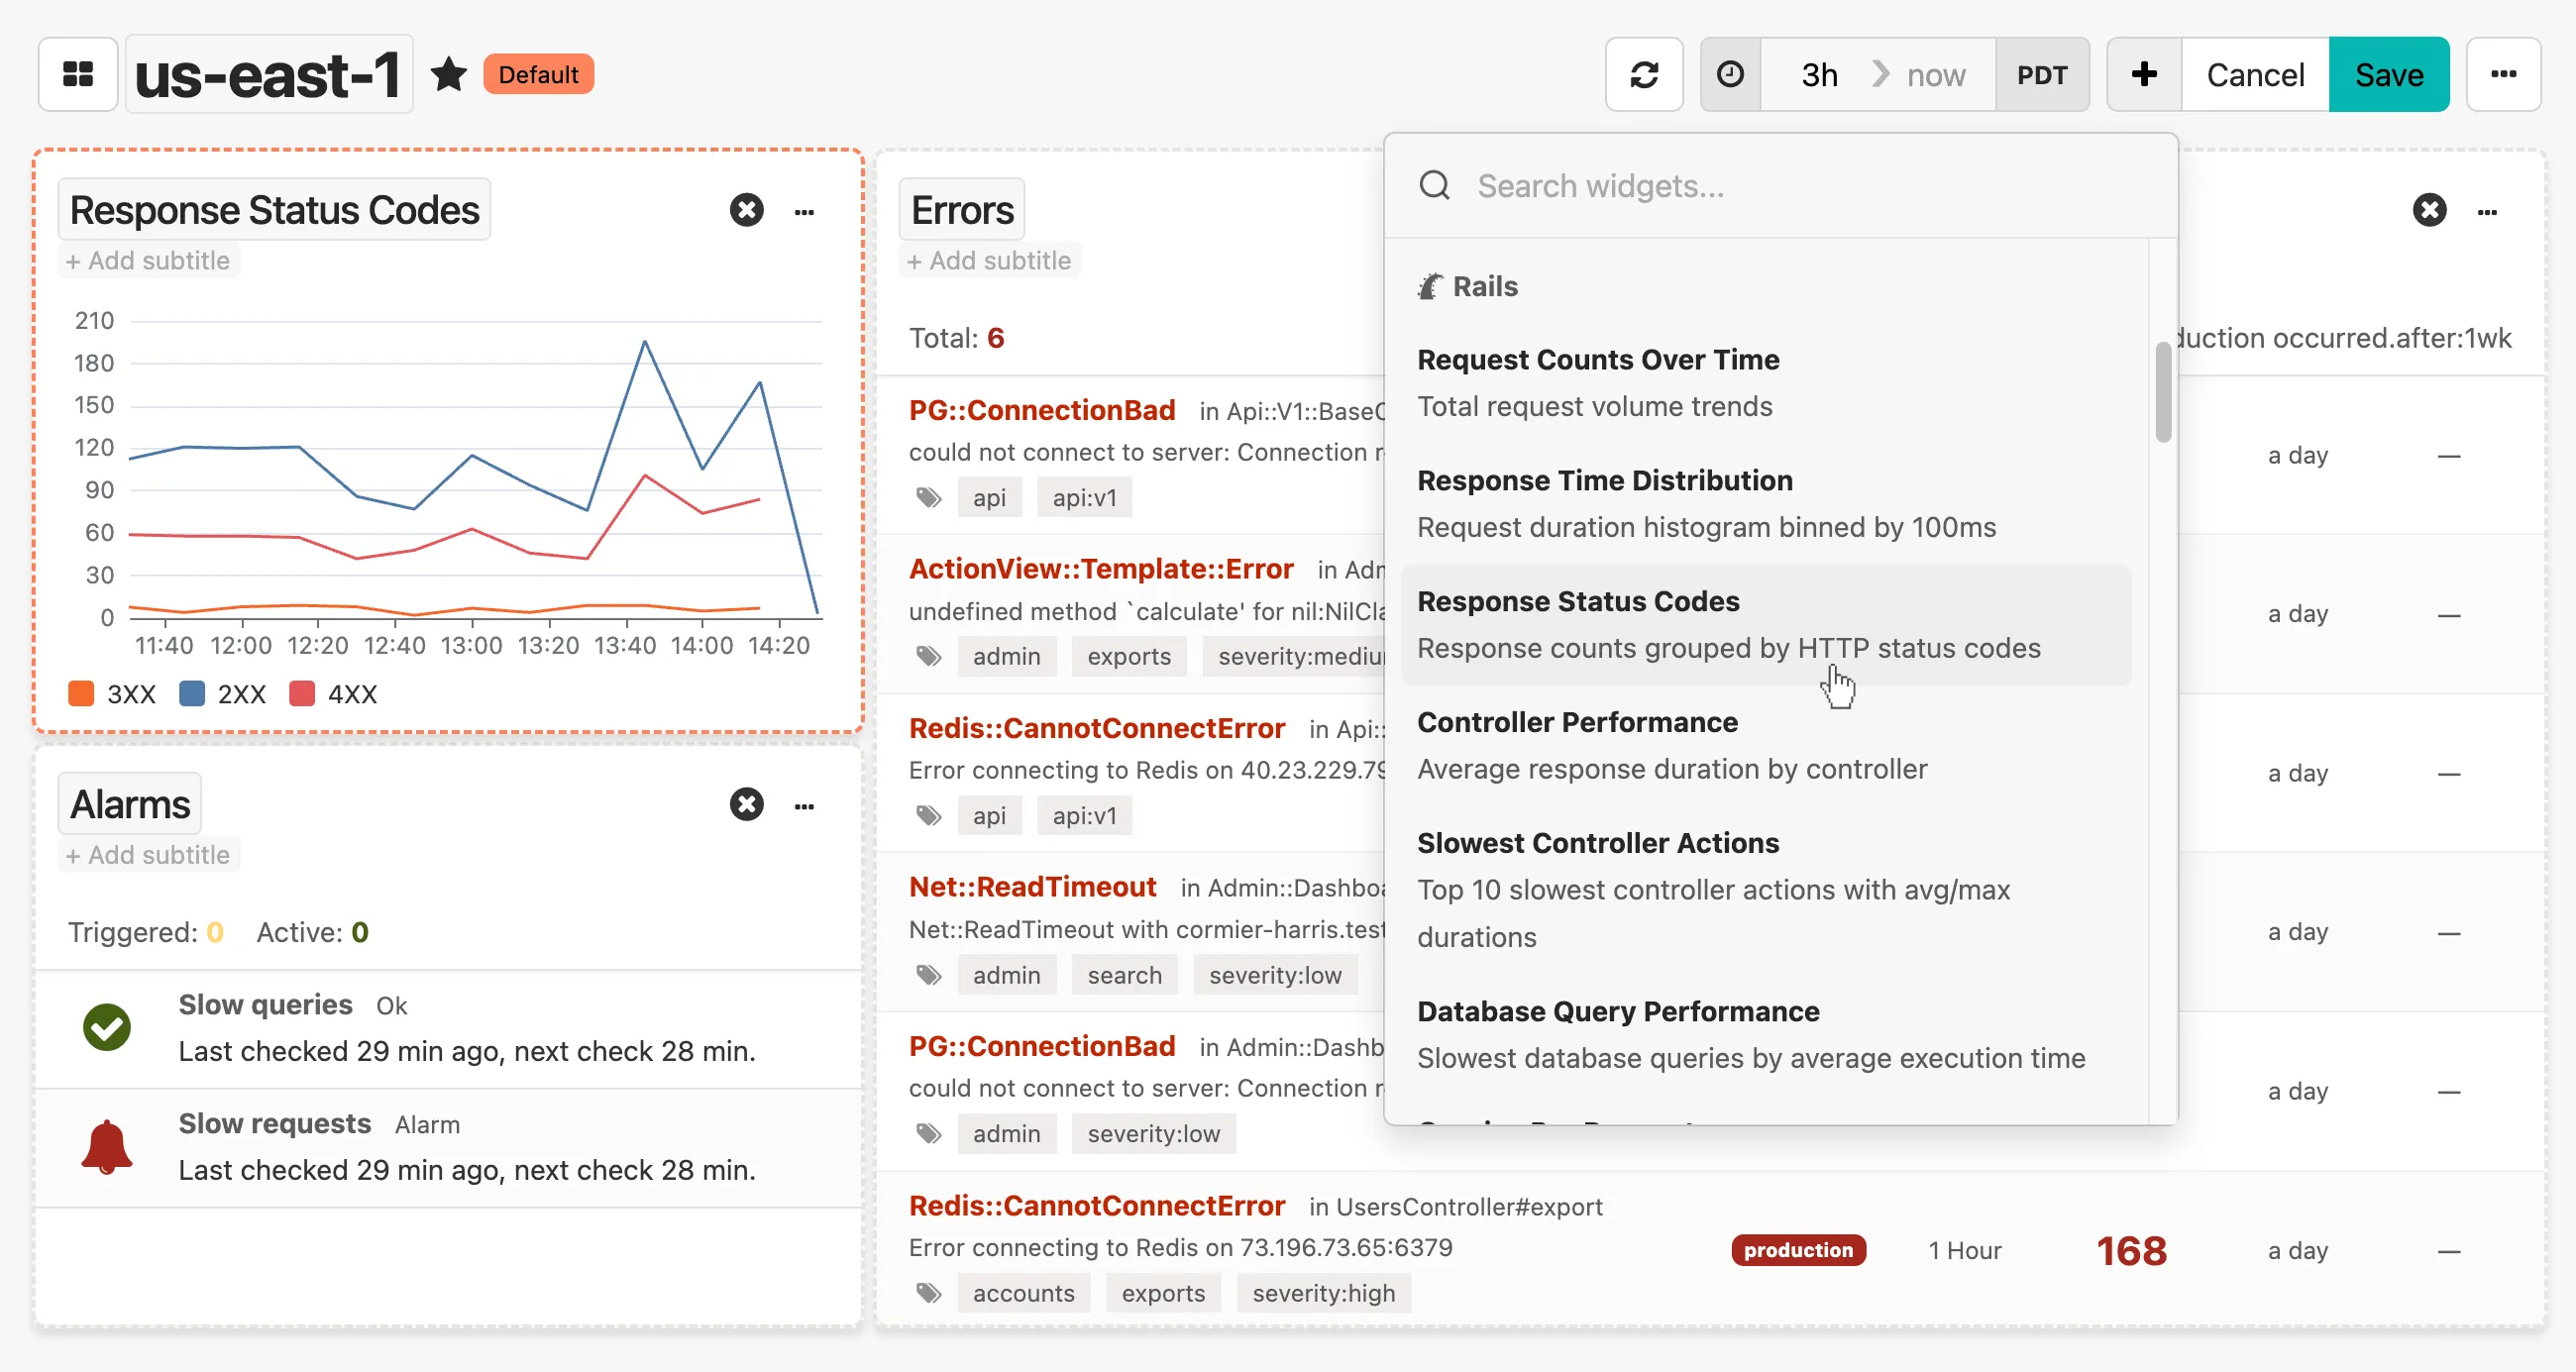
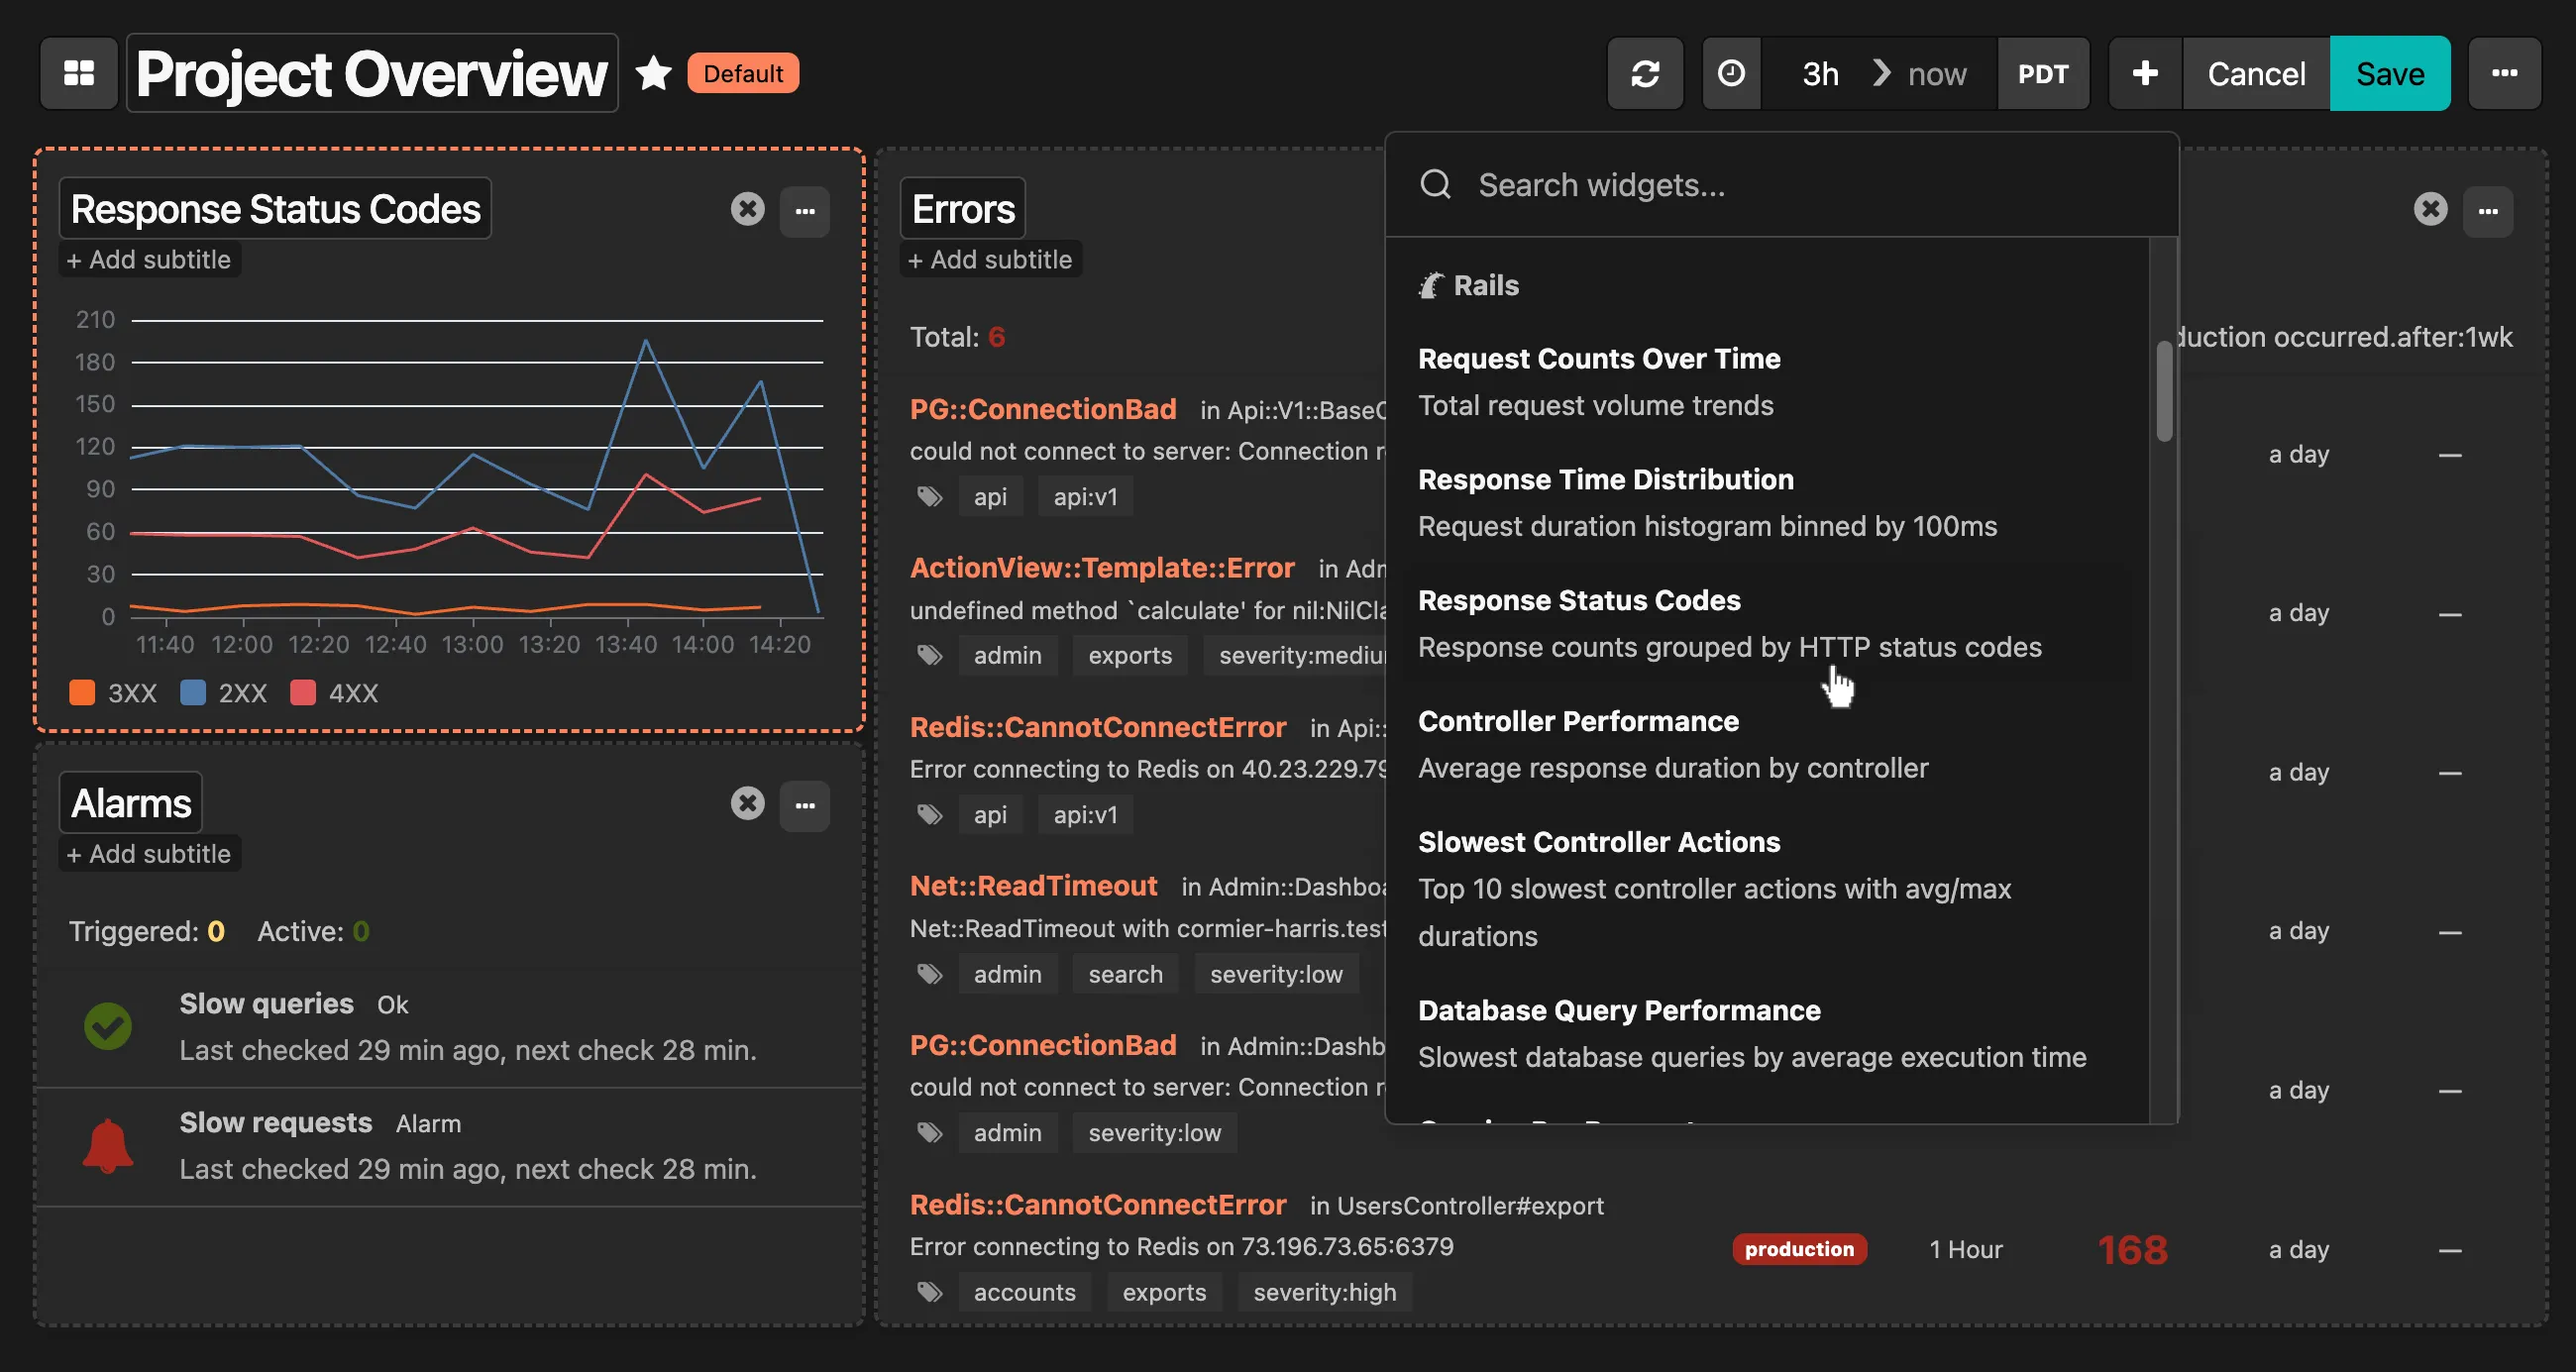
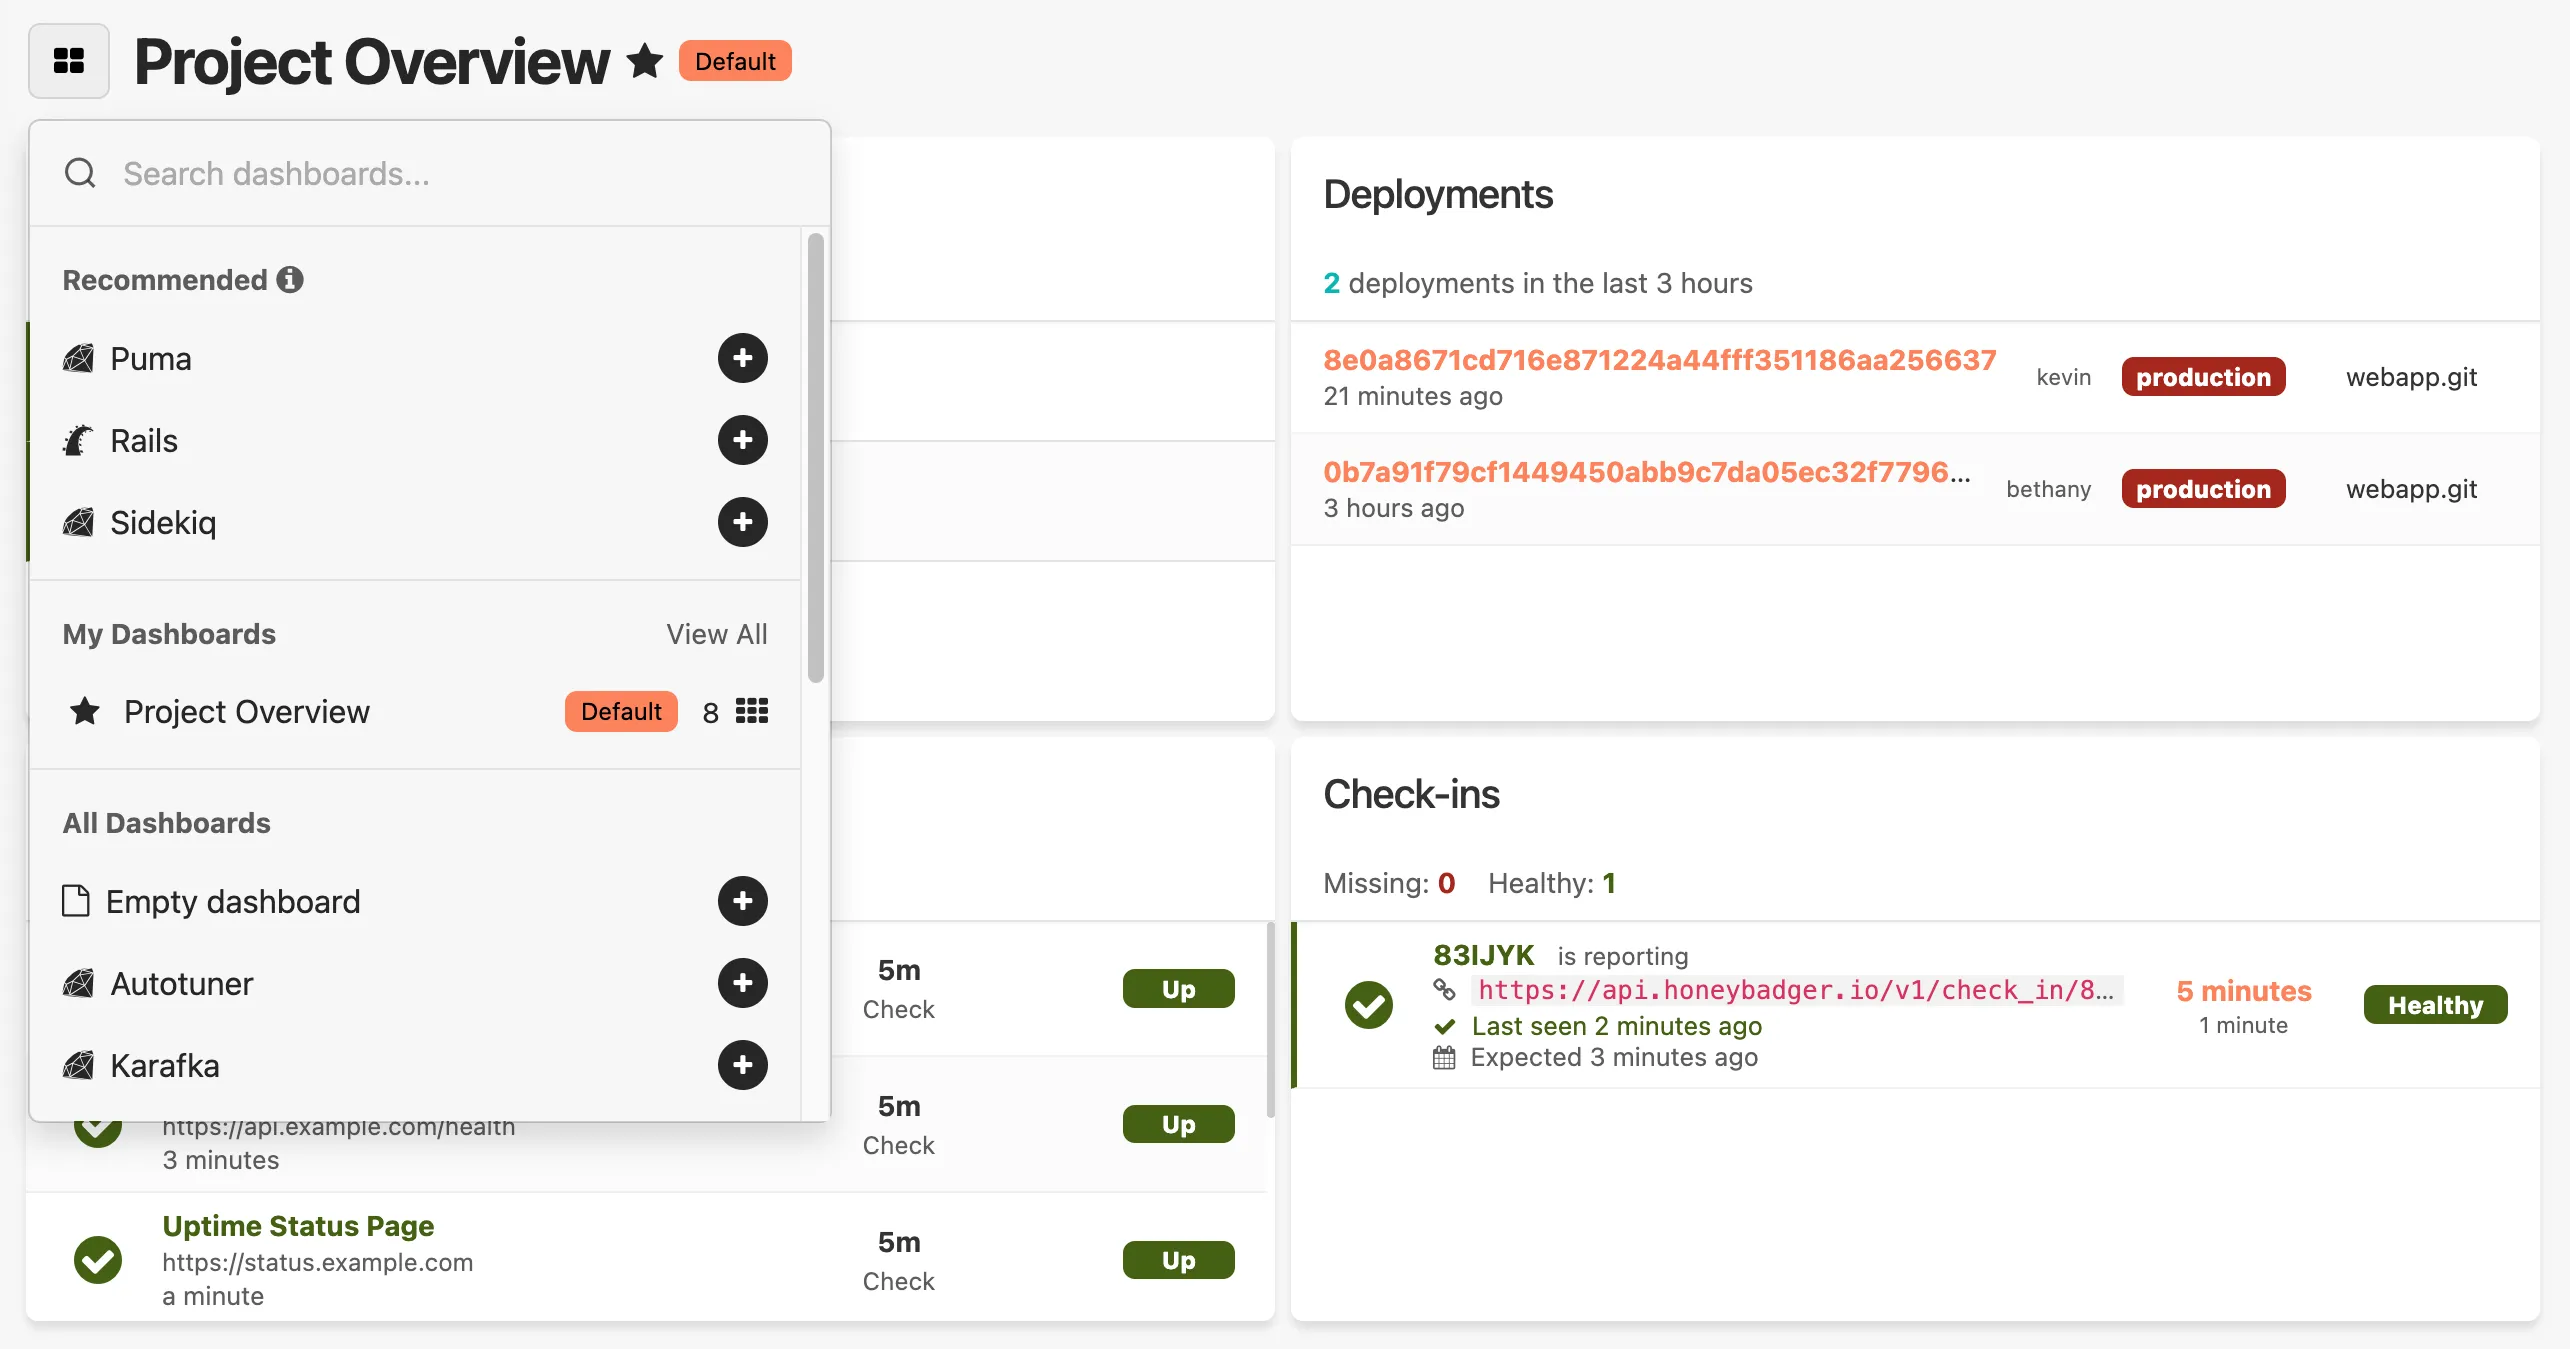
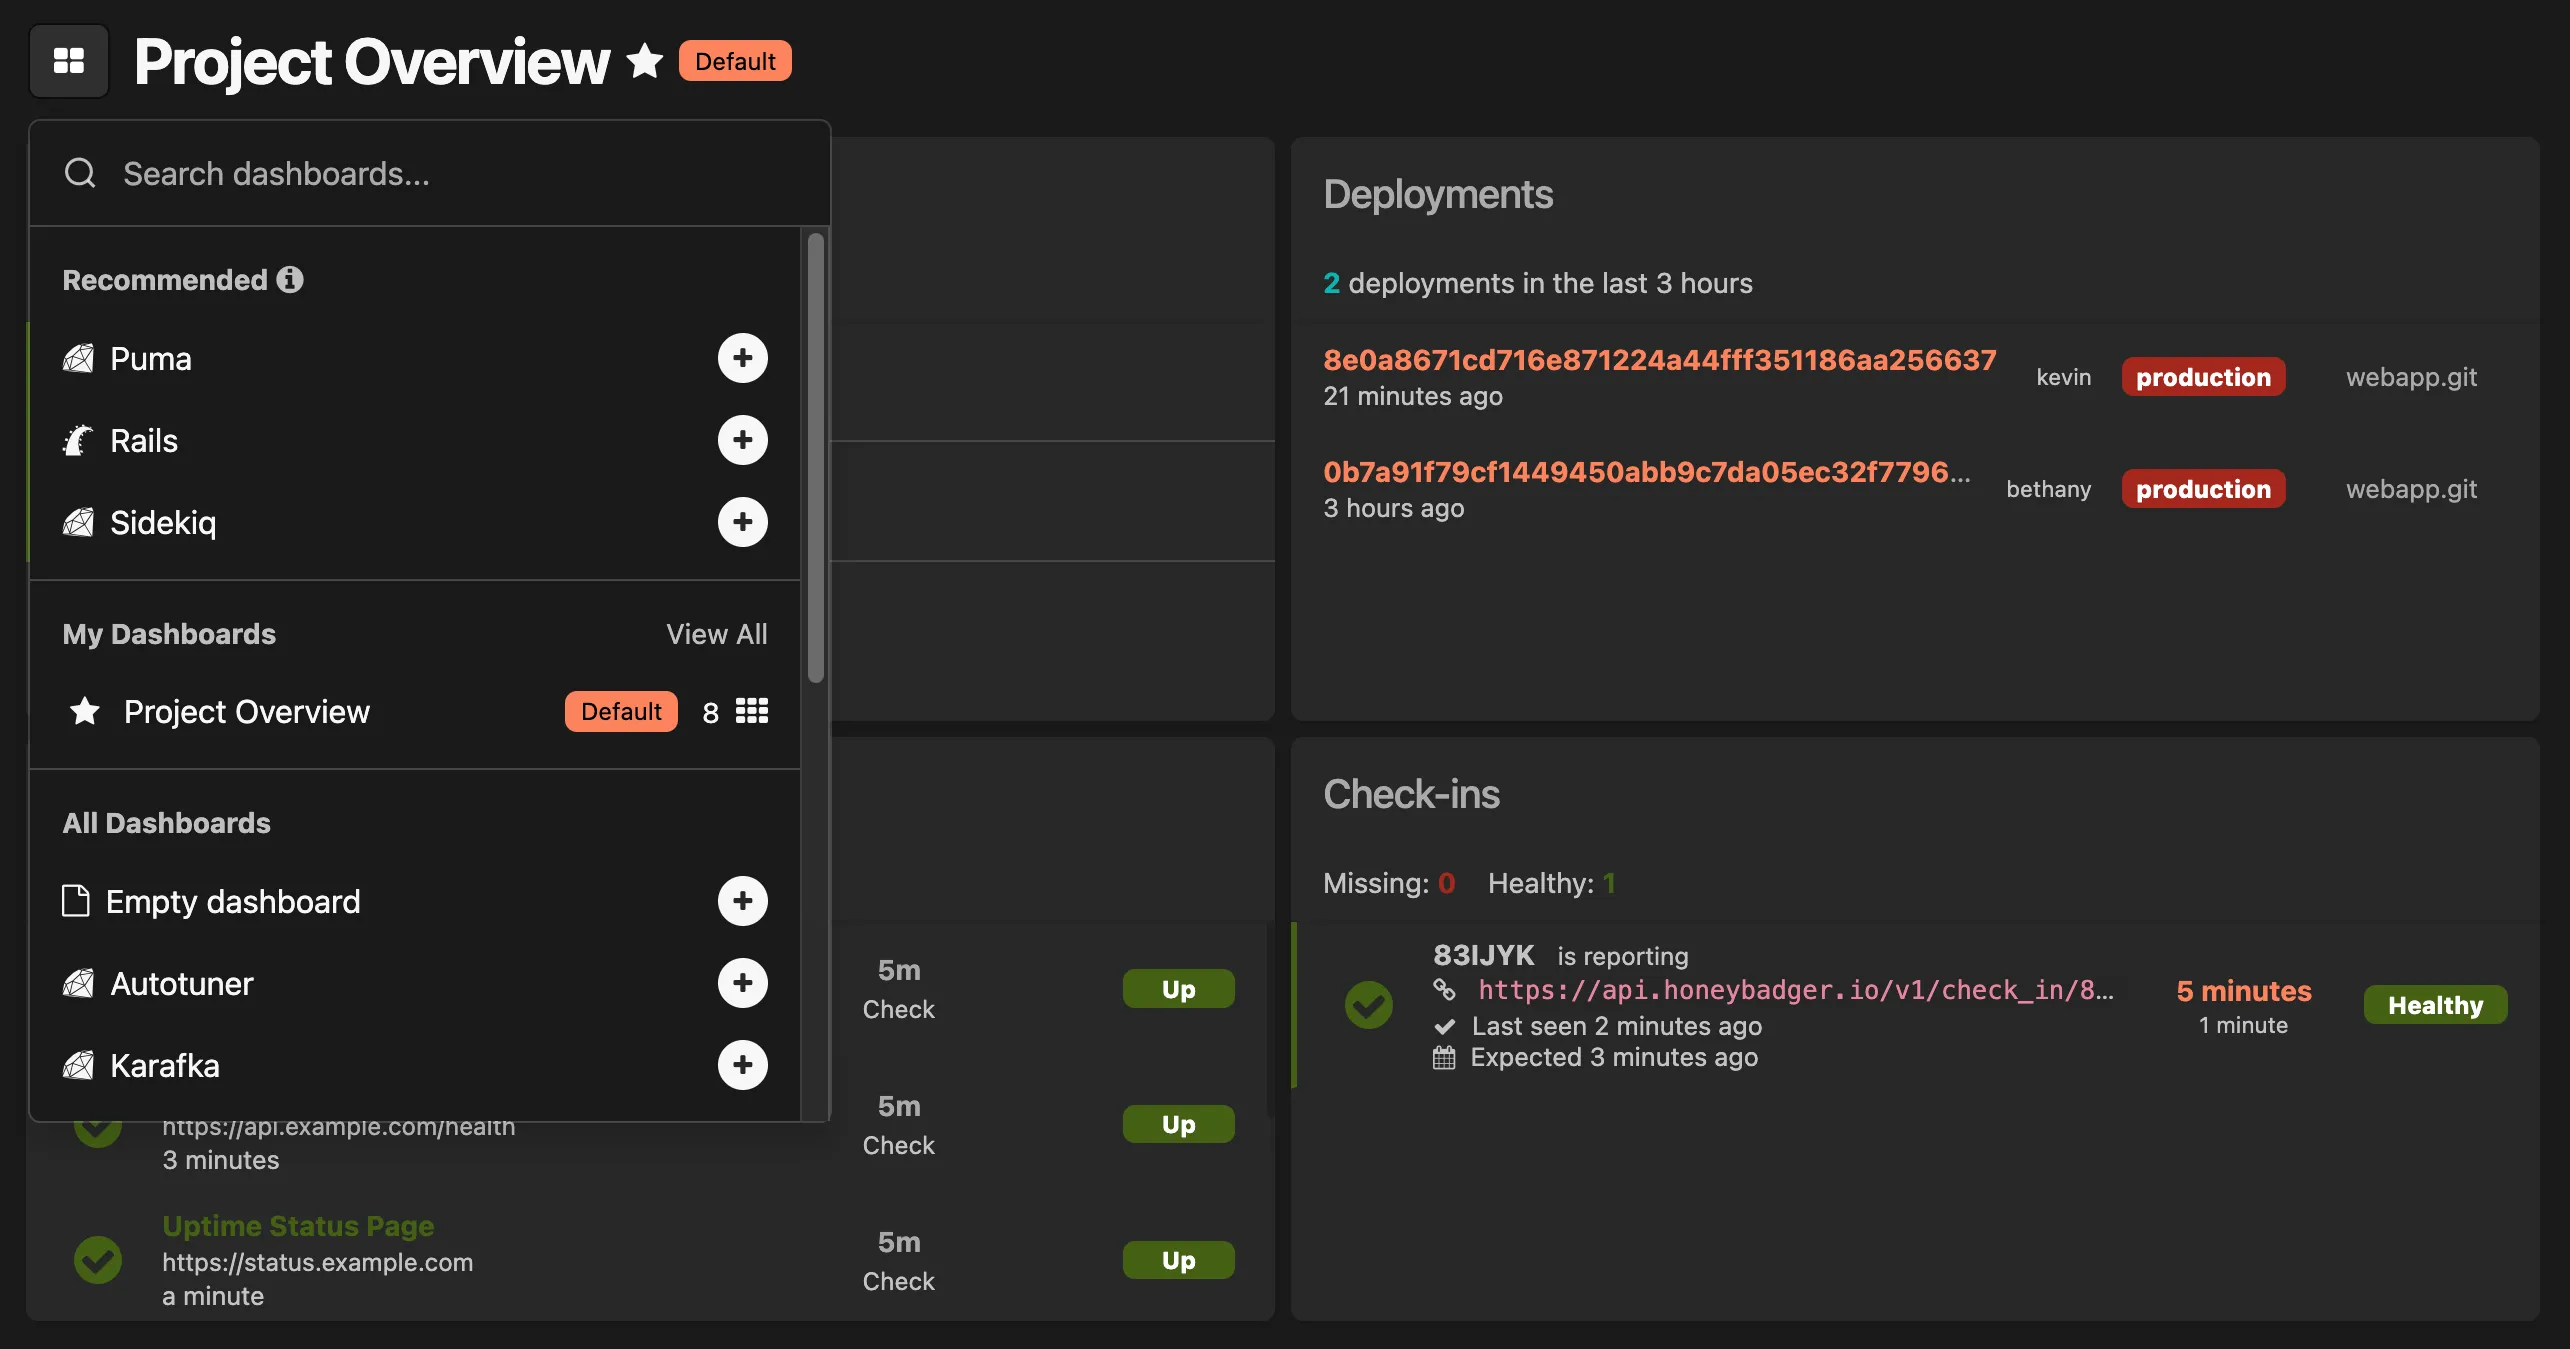
Automagic dashboards for your stack
Honeybadger automatically creates dashboards for your frameworks and platforms. Connect your application framework and dozens of other tools to get instant visibility into application-specific metrics that matter. No configuration required.
Build and customize quickly
Mix and match widgets from our library to build dashboards that your team will actually use—and do it quickly. Drag and drop pre-configured widgets for error trends, application performance, infrastructure health, and more.
Watch and improve any metric
Every event in Honeybadger — from errors to application logs and beyond — is data you can query, visualize, and alert on. Build custom widgets to answer questions unique to your application and business, often without custom instrumentation.
When you do want to add some custom data, our SDKs have you covered:
# Send custom events
Honeybadger.event('user_activity', { action: 'signed_up', user_id: 123 })

# Track values over time
Honeybadger.gauge('data_size', ->{ file.byte_size })

# Measure expensive operations
Honeybadger.time('build_export', ->{ export.build })

# Increment and decrement counters
Honeybadger.increment_counter('add_to_basket', { item_id: item.id })
Once recorded, Honeybadger makes it easy to query and chart the values from any event source.
Built for devs supporting apps in production
Quick dashboard switching. One-click favorites. Shareable links. Inline documentation. We obsess over these details because we use Honeybadger every day — and we know you need to move fast, especially when it matters most.
Get support from the devs who made Honeybadger
Honeybadger is simple, but observability can be complex. That's why our support team is staffed by developers with deep monitoring expertise. Email us and get a thoughtful response from someone who understands your stack — not a ticket number. We'll help you build the perfect dashboard, optimize your queries, or troubleshoot when things get weird.

Ben Curtis
To: Jason Charnes
Subject: Re: Uploading logs
Happy to help! And thanks for letting me know it (mostly) worked. I guess I have some debugging to do on that environment variable. :)
One last thing... make sure you run this to get Vector to start after a reboot:
sudo systemctl enable vector.serviceI put that in the gist after I sent the last email to you, so you may have done that already, but you may not have, and it doesn't hurt to do it twice. :)
Oh, and about the log prefix you mentioned... look in config/environments/production.rb for config.log_tags and comment that out. That's probably what's adding
that stuff to your logs.

Jason Charnes
To: Honeybadger Support
Subject: Re: Uploading logs
That did the trick!!
This is so awesome. Again, thank you!
Dashboards that solve real problems
Honeybadger adapts to how your team works. Whether you're debugging production, optimizing performance, or shipping a new feature, here's how dev teams use Honeybadger to drive real value at their companies.
APM & Infrastructure Monitoring
Customer Lifecycle Analysis
SaaS Billing Analysis
Feature Flags
CI/CD Pipeline Monitoring
Real-time Security Monitoring
Start monitoring in minutes.
From setup to deployment to fixing issues — everything moves faster with Honeybadger. See for yourself.