Error Tracking and Application Performance Monitoring
All-in-one app monitoring for solo developers
Built for solo developers working on side projects, software startups, or serious production apps. Everything you need to monitor your web apps — for free, forever.
No credit card required
Monitoring shouldn't be another project
As a solo developer, you're the engineer, ops team, and support desk. Honeybadger gives you production visibility without turning monitoring into a second job.
More signal. Less noise.
Context, not just a stack trace.
One tool instead of five.
"Honeybadger fits me better. It's a simpler product, obvious how to use, and aimed at small companies who care for each customer."
Six dazzling features for solo developers
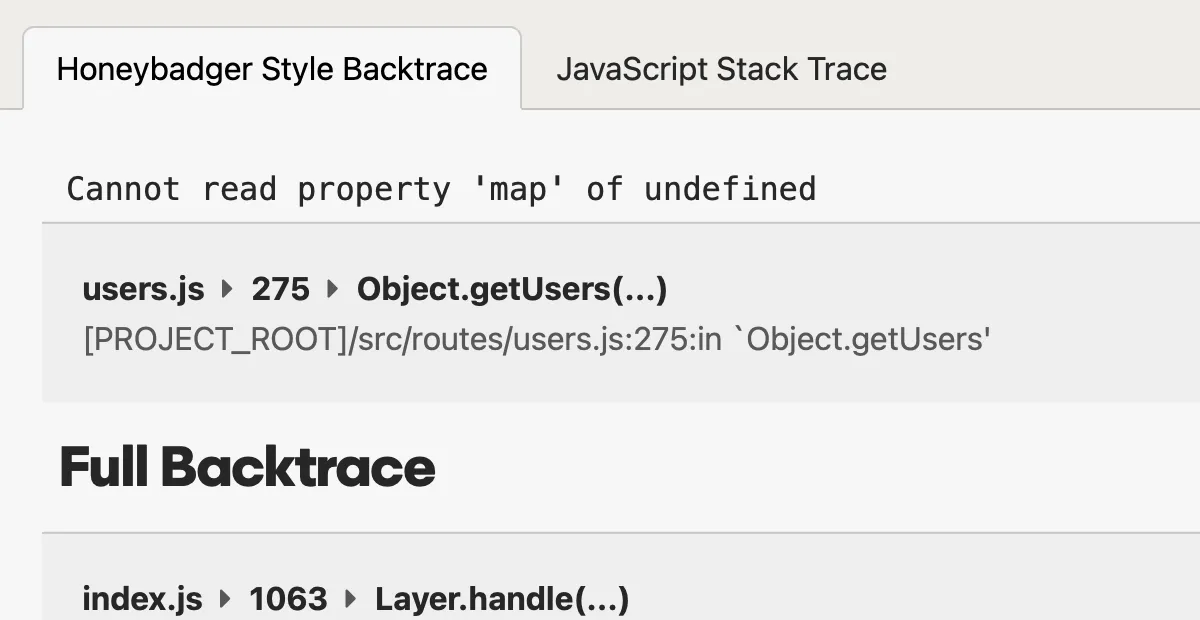
Error Tracking
Fix errors before customers complain
- Instant alerts with rich error context
- Smart grouping reduces noise
- Advanced search and query tools
Logging & Observability
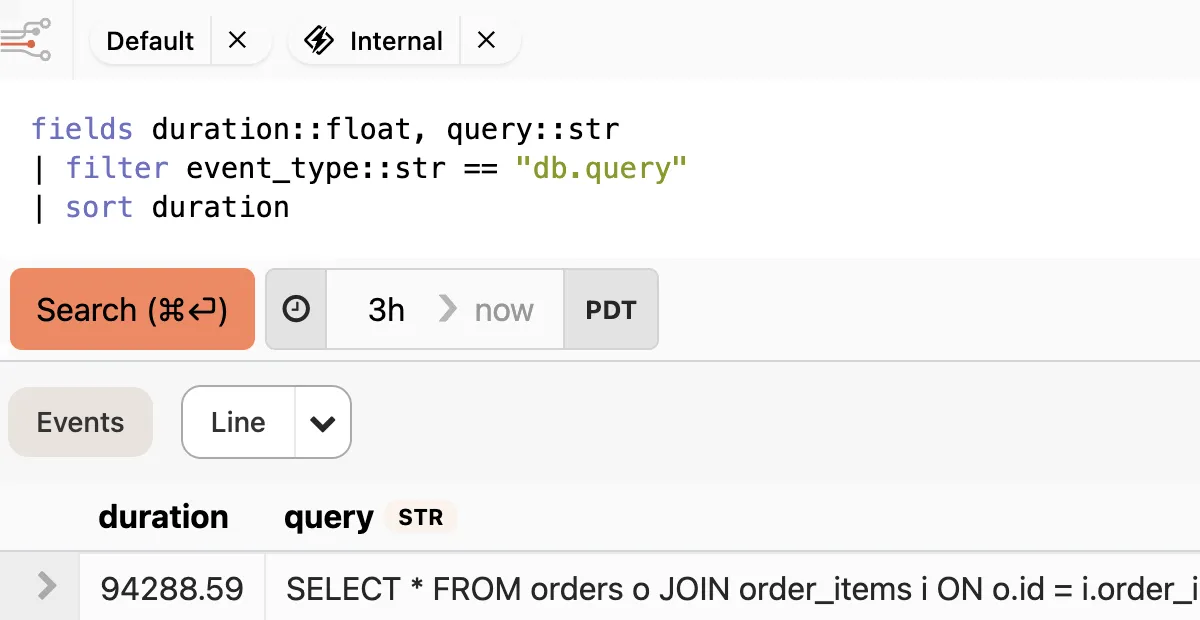
Debug production issues in minutes, not hours
- Structured logs that you can query and analyze
- Trace events across requests, jobs, and services
- Spot patterns with queries and charts
Application Performance Monitoring
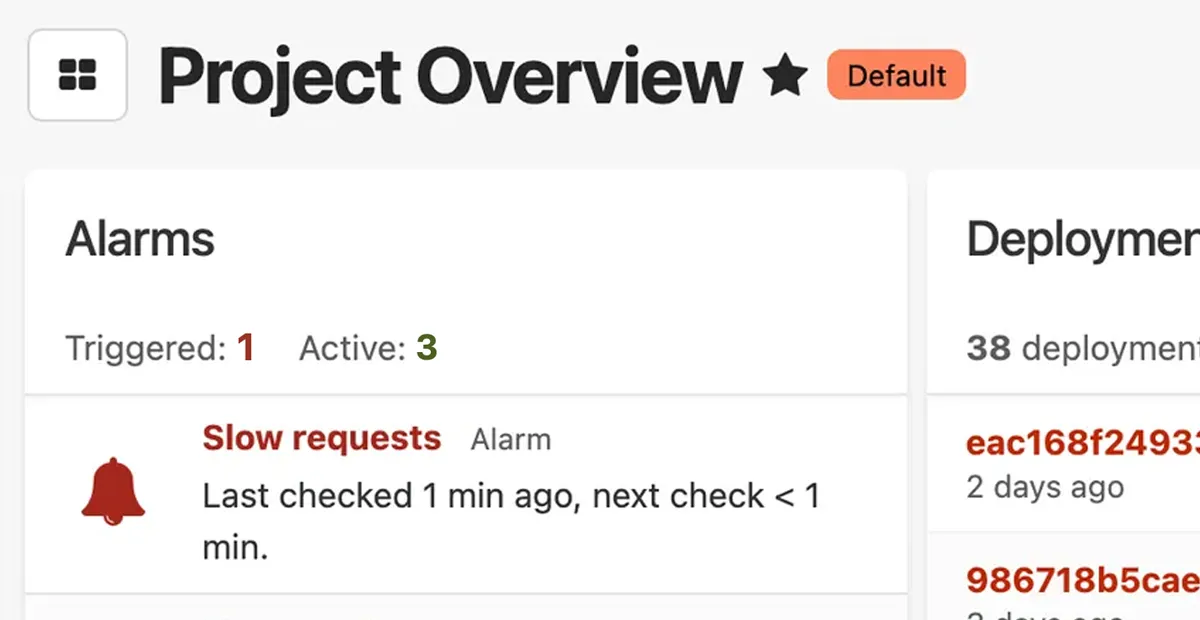
Keep tabs on your apps and infrastructure
- Automatic dashboards for your stack
- Monitor web, worker, and query performance
- Create custom metrics without writing code
Uptime Monitoring
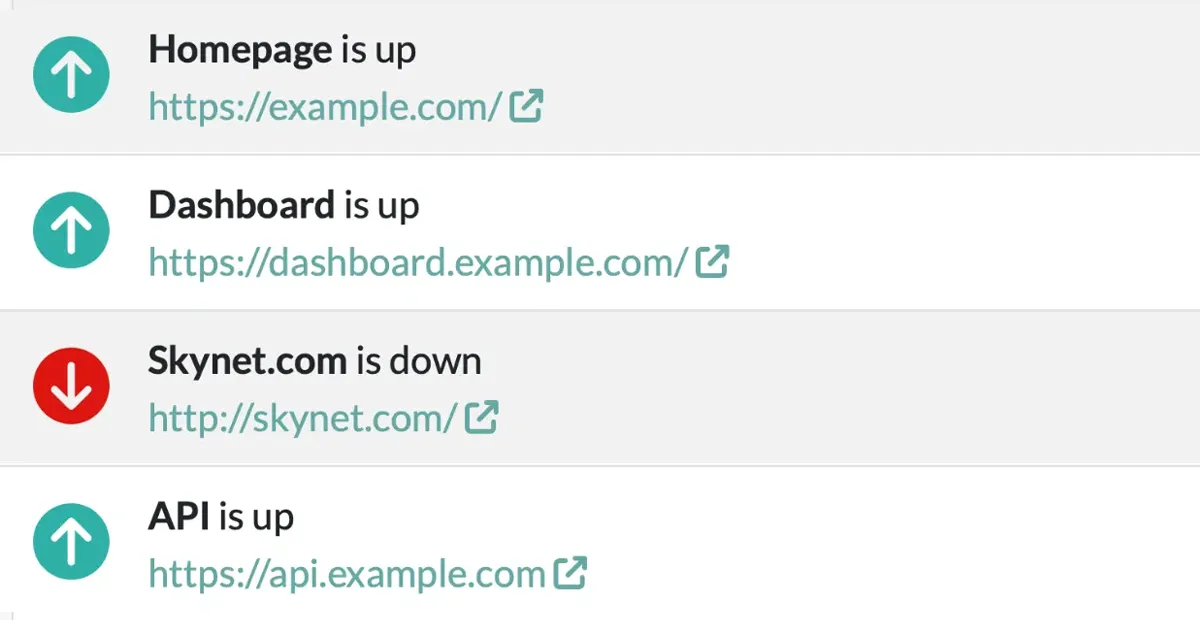
Know when your app is down before your customers do
- Instant alerts when your site goes down
- Know exactly what's broken—not just that it's down
- See uptime issues alongside your errors and logs
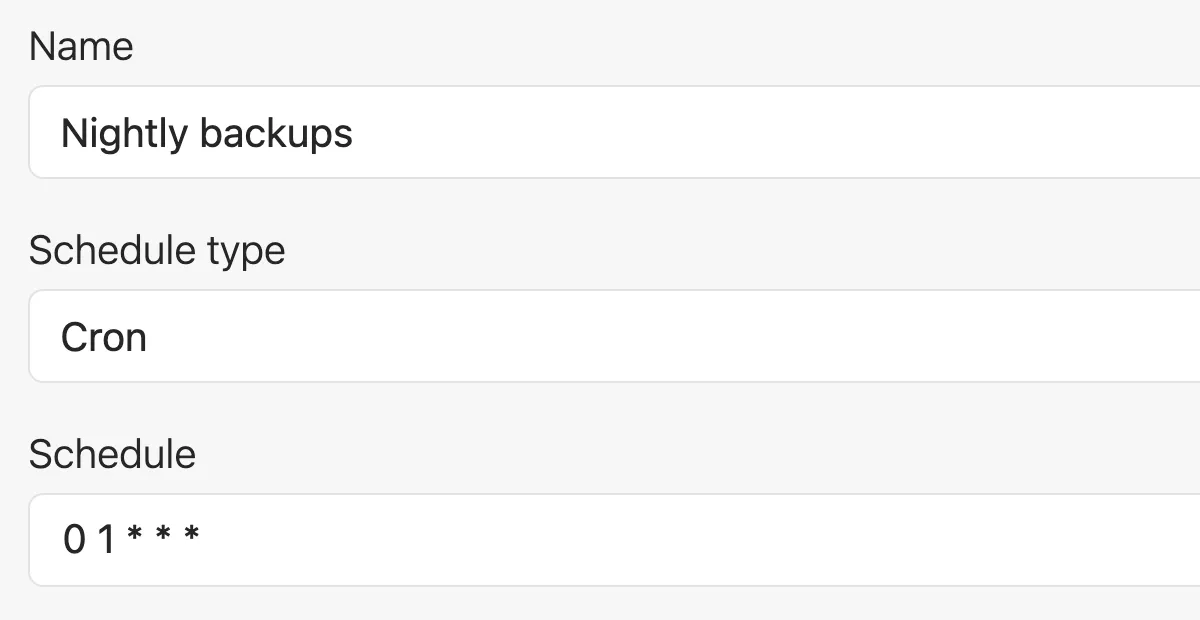
Cron Monitoring & Heartbeats (Check-ins)
Make sure your background jobs and scheduled tasks run on time
- Alerts you when jobs fail or don't run at all
- Tracks success rates and execution over time
- Simple heartbeat API works with any stack
Status Pages
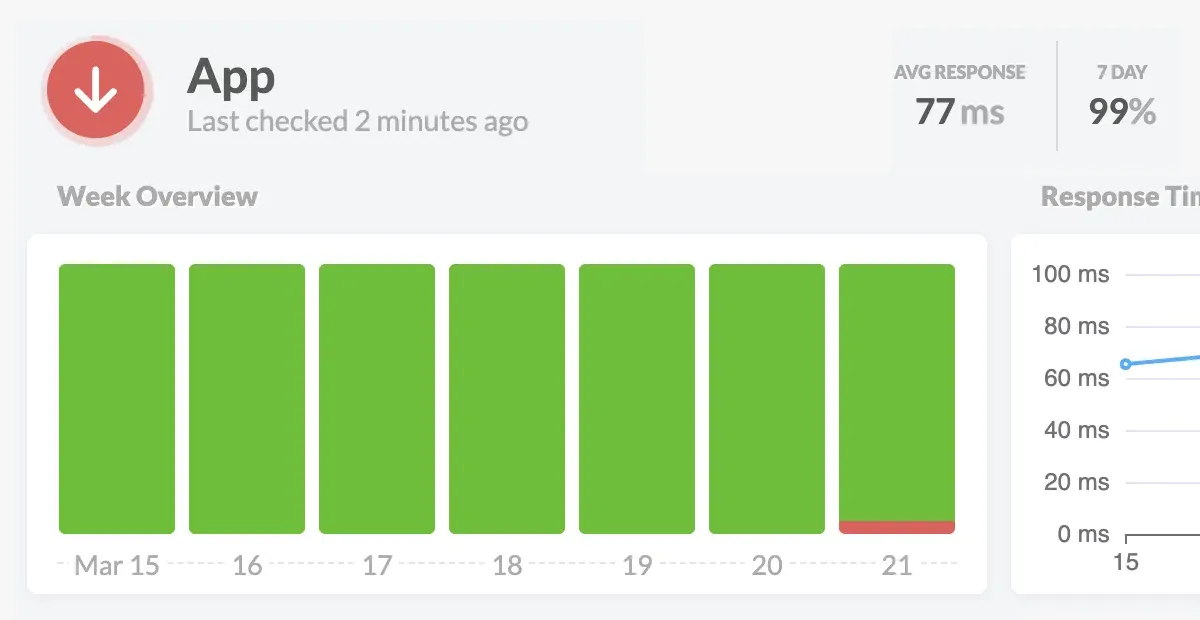
Keep your customers informed during an outage
- Automatically updates when issues are detected
- Reduces support tickets during incidents
- Professional status page with your domain and branding
Small, bootstrapped, and still writing code
Since 2012, our small bootstrapped team has prioritized the needs of our fellow developers. We don't stuff our products with irrelevant features or chase VC growth targets with aggressive sales tactics.
We build products for devs who build and support great web apps in production – just like us.


Joshua Wood & Benjamin Curtis
Honeybadger.io Co-founders
Start monitoring today, not next sprint
Setup takes about five minutes, with defaults that don't need tuning. Find your stack below to see exactly what that looks like.
Once you're running, get alerts in Slack, Discord, email, or wherever you already look. Connect errors to GitHub if that's where you track issues.

"I set up Honeybadger for my app yesterday in like 2 minutes, and having prod errors appear on my phone within seconds is AWESOME! I love this service so far."
Monitor your web apps for free, forever
Honeybadger's Developer plan gives solo developers everything they need to monitor production apps — for free, forever.
You'll get error tracking, logging, performance monitoring, uptime monitoring, and status pages in one platform.
If your project grows and you need unlimited users, higher usage thresholds, or collaboration features, Team plans start at $26/month.
Otherwise, keep using the Developer plan for free, forever.
No credit card required
Frequently Asked Questions
Got questions? We've got answers. Here are some common questions we hear from solo developers about application monitoring:
Is error tracking and application monitoring software a good fit for solo developers?
Yes. You don’t need an engineering team to benefit from application monitoring. You just need an app running in production.
Honeybadger helps solo developers find and fix production problems faster with error tracking, logging, performance monitoring, uptime monitoring, and status pages in one platform. The Developer plan is free forever for one user.
What should solo developers look for in an application monitoring platform?
Look for a platform that’s quick to set up, easy to use, and gives you enough information to diagnose production problems without requiring you to become an observability expert.
For solo developers, a useful free plan, reliable alerts, low maintenance, and responsive support are often more valuable than the advanced configuration and complexity of an enterprise observability platform.
How long does it take to set up Honeybadger?
About five minutes for most frameworks. Install the Honeybadger SDK, deploy your app, and Honeybadger starts monitoring it.
There’s no infrastructure to provision or lengthy implementation process, and Honeybadger’s defaults are designed to work without extensive configuration.
What does onboarding look like for a solo developer?
Sign up for free, install the SDK, and start monitoring your production app right away.
The Developer plan is free forever. If your project grows into a team, you can upgrade to a Team plan at any time.
How much does Honeybadger cost for a developer working alone?
Honeybadger’s Developer plan is free forever for one user. It includes error tracking, logging, performance monitoring, uptime monitoring, and status pages.
If your project grows into a team, paid Team plans start at $26/month and include unlimited users, higher usage thresholds, and collaboration features. See our detailed pricing for the full comparison.
Is application monitoring worth it for an individual developer?
Yes, especially when you can use Honeybadger for free, forever. Application monitoring can save individual developers hours of debugging by helping them find, diagnose, and fix production issues faster.
Plus, Honeybadger delivers error tracking, logging, performance monitoring, uptime monitoring, and status pages, so you can consolidate all your monitoring into a single free platform.
Trusted by developers like you
Tens of thousands of developers use Honeybadger to monitor web apps in production. Here's what they had to say:
"I just want to say, after 21 years of working in web development, this was the easiest signup experience I've ever had. Amazing work."
"This is my second project I've implemented Honeybadger in (it really saved my butt with the first one). Going forward I'll be using Honeybadger for all my projects!"
"Honeybadger is the only service that doesn't look scary like I'm in the cockpit of an airplane."
Start monitoring for free
No credit card, no sales call, no procurement process. Sign up, install the SDK, and see your first error report today.